Sallie Mae 2013 Annual Report Download - page 186
Download and view the complete annual report
Please find page 186 of the 2013 Sallie Mae annual report below. You can navigate through the pages in the report by either clicking on the pages listed below, or by using the keyword search tool below to find specific information within the annual report.-
 1
1 -
2
-
3
-
4
-
5
-
6
-
7
-
8
-
9
-
10
-
11
-
12
-
13
-
14
-
15
-
16
-
17
-
18
-
19
-
20
-
21
-
22
-
23
-
24
-
25
-
26
-
27
-
28
-
29
-
30
-
31
-
32
-
33
-
34
-
35
-
36
-
37
-
38
-
39
-
40
-
41
-
42
-
43
-
44
-
45
-
46
-
47
-
48
-
49
-
50
-
51
-
52
-
53
-
54
-
55
-
56
-
57
-
58
-
59
-
60
-
61
-
62
-
63
-
64
-
65
-
66
-
67
-
68
-
69
-
70
-
71
-
72
-
73
-
74
-
75
-
76
-
77
-
78
-
79
-
80
-
81
-
82
-
83
-
84
-
85
-
86
-
87
-
88
-
89
-
90
-
91
-
92
-
93
-
94
-
95
-
96
-
97
-
98
-
99
-
100
-
101
-
102
-
103
-
104
-
105
-
106
-
107
-
108
-
109
-
110
-
111
-
112
-
113
-
114
-
115
-
116
-
117
-
118
-
119
-
120
-
121
-
122
-
123
-
124
-
125
-
126
-
127
-
128
-
129
-
130
-
131
-
132
-
133
-
134
-
135
-
136
-
137
-
138
-
139
-
140
-
141
-
142
-
143
-
144
-
145
-
146
-
147
-
148
-
149
-
150
-
151
-
152
-
153
-
154
-
155
-
156
-
157
-
158
-
159
-
160
-
161
-
162
-
163
-
164
-
165
-
166
-
167
-
168
-
169
-
170
-
171
-
172
-
173
-
174
-
175
-
 176
176 -
 177
177 -
 178
178 -
 179
179 -
 180
180 -
 181
181 -
 182
182 -
 183
183 -
 184
184 -
 185
185 -
 186
186 -
 187
187 -
 188
188 -
 189
189 -
 190
190 -
 191
191 -
 192
192 -
 193
193 -
 194
194 -
 195
195 -
 196
196 -
197
-
198
-
199
-
200
-
201
-
202
-
203
-
204
-
205
-
206
-
207
-
208
-
209
-
210
-
211
-
212
-
213
-
214
-
215
-
216
-
217
-
218
-
219
-
220
-
221
-
222
-
223
-
224
-
225
-
226
-
227
-
228
-
229
-
230
-
231
-
232
 |
 |

SLM CORPORATION
NOTES TO CONSOLIDATED FINANCIAL STATEMENTS (Continued)
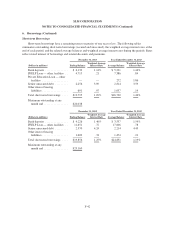
6. Borrowings (Continued)
availability of acceptable collateral. As of December 31, 2013, borrowing capacity was approximately $900
million and there were no outstanding borrowings.
Senior Unsecured Debt
We issued $3.75 billion, $2.7 billion and $2.0 billion of unsecured debt in 2013, 2012 and 2011,
respectively.
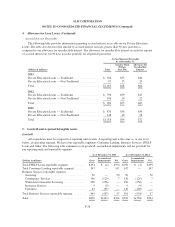
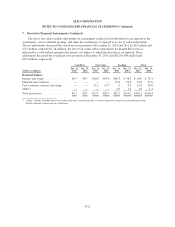
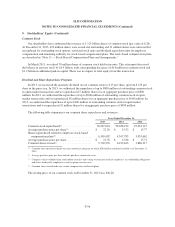
Debt Repurchases
The following table summarizes activity related to our senior unsecured debt and asset-backed securities
(“ABS”) repurchases. “Gains on debt repurchases” is shown net of hedging-related gains and losses.
Years Ended December 31,
(Dollars in millions) 2013 2012 2011
Debt principal repurchased ....................................... $1,279 $711 $894
Gains on debt repurchases ....................................... 42 145 38
7. Derivative Financial Instruments
Risk Management Strategy
We maintain an overall interest rate risk management strategy that incorporates the use of derivative
instruments to minimize the economic effect of interest rate changes. Our goal is to manage interest rate
sensitivity by modifying the repricing frequency and underlying index characteristics of certain balance sheet
assets and liabilities so the net interest margin is not, on a material basis, adversely affected by movements in
interest rates. We do not use derivative instruments to hedge credit risk associated with debt we issued. As a
result of interest rate fluctuations, hedged assets and liabilities will appreciate or depreciate in market value.
Income or loss on the derivative instruments that are linked to the hedged assets and liabilities will generally
offset the effect of this unrealized appreciation or depreciation for the period the item is being hedged. We view
this strategy as a prudent management of interest rate sensitivity. In addition, we utilize derivative contracts to
minimize the economic impact of changes in foreign currency exchange rates on certain debt obligations that are
denominated in foreign currencies. As foreign currency exchange rates fluctuate, these liabilities will appreciate
and depreciate in value. These fluctuations, to the extent the hedge relationship is effective, are offset by changes
in the value of the cross-currency interest rate swaps executed to hedge these instruments. Management believes
certain derivative transactions entered into as hedges, primarily Floor Income Contracts and basis swaps, are
economically effective; however, those transactions generally do not qualify for hedge accounting under GAAP
(as discussed below) and thus may adversely impact earnings.
Although we use derivatives to offset (or minimize) the risk of interest rate and foreign currency changes,
the use of derivatives does expose us to both market and credit risk. Market risk is the chance of financial loss
resulting from changes in interest rates, foreign exchange rates and market liquidity. Credit risk is the risk that a
counterparty will not perform its obligations under a contract and it is limited to the loss of the fair value gain in
a derivative that the counterparty owes us. When the fair value of a derivative contract is negative, we owe the
counterparty and, therefore, have no credit risk exposure to the counterparty; however, the counterparty has
exposure to us. We minimize the credit risk in derivative instruments by entering into transactions with highly
rated counterparties that are reviewed regularly by our Credit Department. We also maintain a policy of requiring
that all derivative contracts be governed by an International Swaps and Derivative Association Master
F-48