Sallie Mae 2013 Annual Report Download - page 80
Download and view the complete annual report
Please find page 80 of the 2013 Sallie Mae annual report below. You can navigate through the pages in the report by either clicking on the pages listed below, or by using the keyword search tool below to find specific information within the annual report.-
 1
1 -
2
-
3
-
4
-
5
-
6
-
7
-
8
-
9
-
10
-
11
-
12
-
13
-
14
-
15
-
16
-
17
-
18
-
19
-
20
-
21
-
22
-
23
-
24
-
25
-
26
-
27
-
28
-
29
-
30
-
31
-
32
-
33
-
34
-
35
-
36
-
37
-
38
-
39
-
40
-
41
-
42
-
43
-
44
-
45
-
46
-
47
-
48
-
49
-
50
-
51
-
52
-
53
-
54
-
55
-
56
-
57
-
58
-
59
-
60
-
61
-
62
-
63
-
64
-
65
-
66
-
67
-
68
-
69
-
 70
70 -
 71
71 -
 72
72 -
 73
73 -
 74
74 -
 75
75 -
 76
76 -
 77
77 -
 78
78 -
 79
79 -
 80
80 -
 81
81 -
 82
82 -
 83
83 -
 84
84 -
 85
85 -
 86
86 -
 87
87 -
 88
88 -
 89
89 -
 90
90 -
91
-
92
-
93
-
94
-
95
-
96
-
97
-
98
-
99
-
100
-
101
-
102
-
103
-
104
-
105
-
106
-
107
-
108
-
109
-
110
-
111
-
112
-
113
-
114
-
115
-
116
-
117
-
118
-
119
-
120
-
121
-
122
-
123
-
124
-
125
-
126
-
127
-
128
-
129
-
130
-
131
-
132
-
133
-
134
-
135
-
136
-
137
-
138
-
139
-
140
-
141
-
142
-
143
-
144
-
145
-
146
-
147
-
148
-
149
-
150
-
151
-
152
-
153
-
154
-
155
-
156
-
157
-
158
-
159
-
160
-
161
-
162
-
163
-
164
-
165
-
166
-
167
-
168
-
169
-
170
-
171
-
172
-
173
-
174
-
175
-
176
-
177
-
178
-
179
-
180
-
181
-
182
-
183
-
184
-
185
-
186
-
187
-
188
-
189
-
190
-
191
-
192
-
193
-
194
-
195
-
196
-
197
-
198
-
199
-
200
-
201
-
202
-
203
-
204
-
205
-
206
-
207
-
208
-
209
-
210
-
211
-
212
-
213
-
214
-
215
-
216
-
217
-
218
-
219
-
220
-
221
-
222
-
223
-
224
-
225
-
226
-
227
-
228
-
229
-
230
-
231
-
232
 |
 |
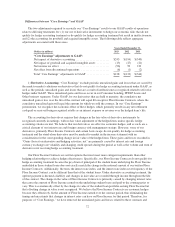
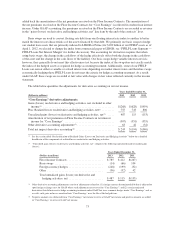
which we have previously charged off estimated losses have, to varying degrees, not met our post-default
recovery expectations to date and may continue to not do so. Our allowance for loan losses takes into account
these potential recovery uncertainties. In the third quarter of 2013, we increased our allowance related to these
potential recovery shortfalls by approximately $112 million. See the section titled “Financial Condition —
Consumer Lending Portfolio Performance — Receivable for Partially Charged-Off Private Education Loans” for
further discussion.
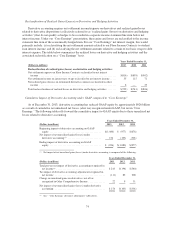
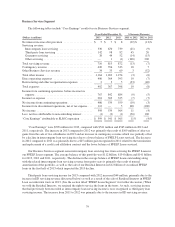
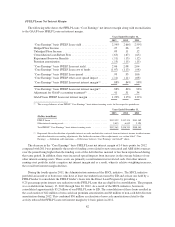
The Private Education Loan provision for loan losses was $787 million for 2013, down $221 million from
the year-ago period and down $392 million from two years ago. This decline over the prior two years was a result
of the overall improvement in credit quality and performance trends discussed above, leading to decreases in
expected future charge-offs. This overall decrease in expected future charge-offs is the net effect of a decrease in
expected future defaults less a smaller decrease in what we expect to recover on such defaults.
For a more detailed discussion of our policy for determining the collectability of Private Education Loans
and maintaining our allowance for Private Education Loan losses, see the section titled “Critical Accounting
Policies and Estimates — Allowance for Loan Losses.”
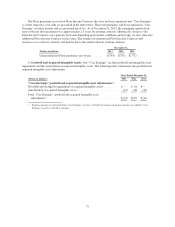
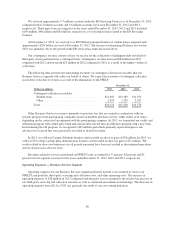
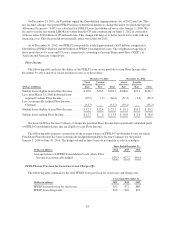
Other Income — Consumer Lending Segment
Servicing revenue for our Consumer Lending segment primarily includes late fees. For the years ended
December 31, 2013, 2012 and 2011, servicing revenue for our Consumer Lending segment totaled $34 million,
$46 million and $64 million, respectively. Included in other income for 2011 was a $9 million mark-to-market
loss related to classifying our entire $12 million portfolio of non-U.S. dollar-denominated student loans as held-
for-sale.
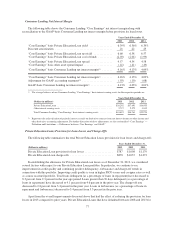
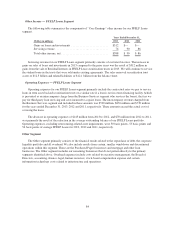
Operating Expenses — Consumer Lending Segment
Operating expenses for our Consumer Lending segment include costs incurred to originate Private
Education Loans and to service and collect on our Private Education Loan portfolio. The increase in operating
expenses of $33 million for 2013 compared with 2012 was primarily the result of increased loan marketing and
collection activities as well as continued investments in technology. The $26 million decline from 2011 to 2012
was primarily the result of cost-cutting initiatives. Direct operating expenses as a percentage of revenues
(revenues calculated as net interest income after provision plus total other income) were 31 percent, 38 percent
and 57 percent in 2013, 2012 and 2011, respectively.
78