Sallie Mae 2013 Annual Report Download - page 211
Download and view the complete annual report
Please find page 211 of the 2013 Sallie Mae annual report below. You can navigate through the pages in the report by either clicking on the pages listed below, or by using the keyword search tool below to find specific information within the annual report.-
 1
1 -
2
-
3
-
4
-
5
-
6
-
7
-
8
-
9
-
10
-
11
-
12
-
13
-
14
-
15
-
16
-
17
-
18
-
19
-
20
-
21
-
22
-
23
-
24
-
25
-
26
-
27
-
28
-
29
-
30
-
31
-
32
-
33
-
34
-
35
-
36
-
37
-
38
-
39
-
40
-
41
-
42
-
43
-
44
-
45
-
46
-
47
-
48
-
49
-
50
-
51
-
52
-
53
-
54
-
55
-
56
-
57
-
58
-
59
-
60
-
61
-
62
-
63
-
64
-
65
-
66
-
67
-
68
-
69
-
70
-
71
-
72
-
73
-
74
-
75
-
76
-
77
-
78
-
79
-
80
-
81
-
82
-
83
-
84
-
85
-
86
-
87
-
88
-
89
-
90
-
91
-
92
-
93
-
94
-
95
-
96
-
97
-
98
-
99
-
100
-
101
-
102
-
103
-
104
-
105
-
106
-
107
-
108
-
109
-
110
-
111
-
112
-
113
-
114
-
115
-
116
-
117
-
118
-
119
-
120
-
121
-
122
-
123
-
124
-
125
-
126
-
127
-
128
-
129
-
130
-
131
-
132
-
133
-
134
-
135
-
136
-
137
-
138
-
139
-
140
-
141
-
142
-
143
-
144
-
145
-
146
-
147
-
148
-
149
-
150
-
151
-
152
-
153
-
154
-
155
-
156
-
157
-
158
-
159
-
160
-
161
-
162
-
163
-
164
-
165
-
166
-
167
-
168
-
169
-
170
-
171
-
172
-
173
-
174
-
175
-
176
-
177
-
178
-
179
-
180
-
181
-
182
-
183
-
184
-
185
-
186
-
187
-
188
-
189
-
190
-
191
-
192
-
193
-
194
-
195
-
196
-
197
-
198
-
199
-
200
-
 201
201 -
 202
202 -
 203
203 -
 204
204 -
 205
205 -
 206
206 -
 207
207 -
 208
208 -
 209
209 -
 210
210 -
 211
211 -
 212
212 -
 213
213 -
 214
214 -
 215
215 -
 216
216 -
 217
217 -
 218
218 -
 219
219 -
 220
220 -
 221
221 -
222
-
223
-
224
-
225
-
226
-
227
-
228
-
229
-
230
-
231
-
232
 |
 |

SLM CORPORATION
NOTES TO CONSOLIDATED FINANCIAL STATEMENTS (Continued)
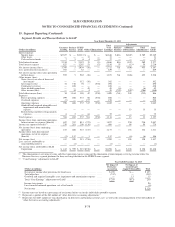
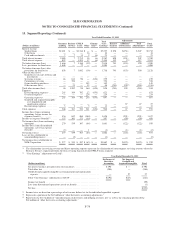
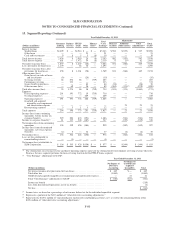
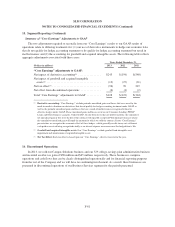
15. Segment Reporting (Continued)
through financial aid, federal loans or customers’ resources. We continue to offer loan products to parents and
graduate students where we believe we are competitive with similar federal education loan products. In this
segment, we earn net interest income on our Private Education Loan portfolio (after provision for loan losses).
Operating expenses for this segment include costs incurred to acquire and to service our loans. With the
elimination of FFELP in July 2010, these FFELP-related revenue sources will continue to decline.
Managed growth of our Private Education Loan portfolio is central not only to our strategy for growing the
Consumer Lending segment but also for the future of Sallie Mae Bank. In 2013, we originated $3.8 billion of
Private Education Loans, an increase of 14 percent and 39 percent from the years ended December 31, 2012 and
2011, respectively. As of December 31, 2013, 2012 and 2011, we had $37.5 billion, $36.9 billion, and $36.3
billion of Private Education Loans outstanding, respectively.
Private Education Loans bear the full credit risk of the customer and cosigner. We manage this risk by
underwriting and pricing based upon customized credit scoring criteria and the addition of qualified cosigners.
For the year ended December 31, 2013, our annual charge-off rate for Private Education Loans (as a percentage
of loans in repayment) was 2.8 percent, as compared with 3.4 percent for the prior year.
Since the beginning of 2006, virtually all of our Private Education Loans have been originated and funded
by Sallie Mae Bank. At December 31, 2013, Sallie Mae Bank had total assets of $10.7 billion, including $6.7
billion in Private Education Loans and $1.4 billion of FFELP Loans. As of the same date, Sallie Mae Bank had
total deposits of $9.2 billion. Sallie Mae Bank currently relies on both retail and brokered deposits to fund its
assets and periodically sells originated Private Education Loans to affiliates for inclusion in securitization trusts
or collection.
We face competition for Private Education Loans from a group of the nation’s larger banks and local credit
unions.
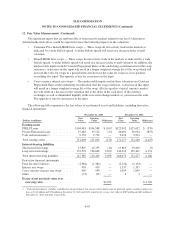
The following table includes asset information for our Consumer Lending segment.
December 31,
(Dollars in millions) 2013 2012
Private Education Loans, net ......................................... $37,512 $36,934
Cash and investments(1) ............................................. 2,555 2,731
Other ........................................................... 2,934 3,275
Total assets ...................................................... $43,001 $42,940
(1) Includes restricted cash and investments.
Business Services Segment
We are currently the largest holder, servicer and collector of loans made under the previously existing
FFELP, and the majority of our income has been derived, directly or indirectly, from our portfolio of FFELP
Loans and servicing we have provided for FFELP Loans. In 2010, Congress passed legislation ending the
origination of education loans under FFELP. The terms and conditions of existing FFELP Loans were not
affected by this legislation. Our FFELP Loan portfolio will amortize over approximately 20 years. The fee
income we have earned from providing servicing and contingent collections services on such loans will similarly
decline over time. We also provide servicing, loan default aversion and defaulted loans collection services on
F-73