Sallie Mae 2013 Annual Report Download - page 81
Download and view the complete annual report
Please find page 81 of the 2013 Sallie Mae annual report below. You can navigate through the pages in the report by either clicking on the pages listed below, or by using the keyword search tool below to find specific information within the annual report.-
 1
1 -
2
-
3
-
4
-
5
-
6
-
7
-
8
-
9
-
10
-
11
-
12
-
13
-
14
-
15
-
16
-
17
-
18
-
19
-
20
-
21
-
22
-
23
-
24
-
25
-
26
-
27
-
28
-
29
-
30
-
31
-
32
-
33
-
34
-
35
-
36
-
37
-
38
-
39
-
40
-
41
-
42
-
43
-
44
-
45
-
46
-
47
-
48
-
49
-
50
-
51
-
52
-
53
-
54
-
55
-
56
-
57
-
58
-
59
-
60
-
61
-
62
-
63
-
64
-
65
-
66
-
67
-
68
-
69
-
70
-
 71
71 -
 72
72 -
 73
73 -
 74
74 -
 75
75 -
 76
76 -
 77
77 -
 78
78 -
 79
79 -
 80
80 -
 81
81 -
 82
82 -
 83
83 -
 84
84 -
 85
85 -
 86
86 -
 87
87 -
 88
88 -
 89
89 -
 90
90 -
 91
91 -
92
-
93
-
94
-
95
-
96
-
97
-
98
-
99
-
100
-
101
-
102
-
103
-
104
-
105
-
106
-
107
-
108
-
109
-
110
-
111
-
112
-
113
-
114
-
115
-
116
-
117
-
118
-
119
-
120
-
121
-
122
-
123
-
124
-
125
-
126
-
127
-
128
-
129
-
130
-
131
-
132
-
133
-
134
-
135
-
136
-
137
-
138
-
139
-
140
-
141
-
142
-
143
-
144
-
145
-
146
-
147
-
148
-
149
-
150
-
151
-
152
-
153
-
154
-
155
-
156
-
157
-
158
-
159
-
160
-
161
-
162
-
163
-
164
-
165
-
166
-
167
-
168
-
169
-
170
-
171
-
172
-
173
-
174
-
175
-
176
-
177
-
178
-
179
-
180
-
181
-
182
-
183
-
184
-
185
-
186
-
187
-
188
-
189
-
190
-
191
-
192
-
193
-
194
-
195
-
196
-
197
-
198
-
199
-
200
-
201
-
202
-
203
-
204
-
205
-
206
-
207
-
208
-
209
-
210
-
211
-
212
-
213
-
214
-
215
-
216
-
217
-
218
-
219
-
220
-
221
-
222
-
223
-
224
-
225
-
226
-
227
-
228
-
229
-
230
-
231
-
232
 |
 |

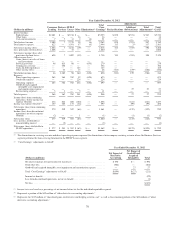
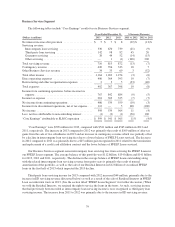
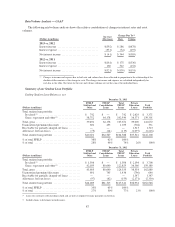
Business Services Segment
The following tables include “Core Earnings” results for our Business Services segment.
Years Ended December 31, % Increase (Decrease)
(Dollars in millions) 2013 2012 2011 2013 vs. 2012 2012 vs. 2011
Net interest income after provision .................... $ 5 $ 7 $ 8 (29)% (13)%
Servicing revenue:
Intercompany loan servicing ....................... 530 670 739 (21) (9)
Third-party loan servicing ......................... 142 98 82 45 20
Guarantor servicing .............................. 38 44 52 (14) (15)
Other servicing .................................. — 1 (1) (100) 200
Total servicing revenue ............................. 710 813 872 (13) (7)
Contingency revenue ............................... 420 356 333 18 7
Other Business Services revenue ...................... 34 33 69 3 (52)
Total other income ................................. 1,164 1,202 1,274 (3) (6)
Direct operating expenses ........................... 400 364 393 10 (7)
Restructuring and other reorganization expenses .........235(33) (40)
Total expenses .................................... 402 367 398 10 (8)
Income from continuing operations, before income tax
expense ........................................ 767 842 884 (9) (5)
Income tax expense ................................ 281 303 325 (7) (7)
Net income from continuing operations ................. 486 539 559 (10) (3)
Income from discontinued operations, net of tax expense . . . 112 — 5 100 (100)
Net income ....................................... 598 539 564 11 (4)
Less: net loss attributable to noncontrolling interest ....... (1) (2) (1) (50) 100
“Core Earnings” attributable to SLM Corporation ........ $ 599 $ 541 $ 565 11% (4)%
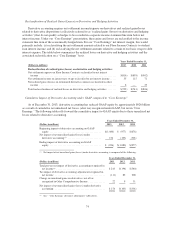
“Core Earnings” were $599 million for 2013, compared with $541 million and $565 million in 2012 and
2011, respectively. The increase in 2013 compared to 2012 was primarily the result of $109 million of after-tax
gains from the sale of two subsidiaries in 2013 and an increase in contingency revenue which was partially offset
by a decline in intercompany loan servicing fees due to a lower balance of FFELP Loans serviced. The decrease
in 2012 compared to 2011 was primarily due to a $25 million gain recognized in 2011 related to the termination
and replacement of a credit card affiliation contract and the lower balance of FFELP Loans serviced.
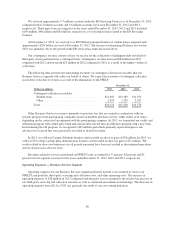
Our Business Services segment earns intercompany loan servicing fees from servicing the FFELP Loans in
our FFELP Loans segment. The average balance of this portfolio was $112 billion, $134 billion and $141 billion
for 2013, 2012 and 2011, respectively. The decline in the average balance of FFELP Loans outstanding along
with the related intercompany loan servicing revenue from prior years is primarily the result of normal
amortization of the portfolio, as well as the sale of our Residual Interests in $12 billion of securitized FFELP
loans in the first half of 2013 which impacted the 2013 decline.
Third-party loan servicing income for 2013 compared with 2012 increased $44 million, primarily due to the
increase in ED servicing revenue (discussed below) as well as a result of the sale of Residual Interests in FFELP
Loan securitization trusts in 2013. (See the section titled “FFELP Loans Segment” for further discussion.) When
we sold the Residual Interests, we retained the right to service the loans in the trusts. As such, servicing income
that had previously been recorded as intercompany loan servicing income is now recognized as third-party loan
servicing income. The increase from 2011 to 2012 was primarily due to the increase in ED servicing revenue.
79