Sallie Mae 2013 Annual Report Download - page 62
Download and view the complete annual report
Please find page 62 of the 2013 Sallie Mae annual report below. You can navigate through the pages in the report by either clicking on the pages listed below, or by using the keyword search tool below to find specific information within the annual report.-
 1
1 -
2
-
3
-
4
-
5
-
6
-
7
-
8
-
9
-
10
-
11
-
12
-
13
-
14
-
15
-
16
-
17
-
18
-
19
-
20
-
21
-
22
-
23
-
24
-
25
-
26
-
27
-
28
-
29
-
30
-
31
-
32
-
33
-
34
-
35
-
36
-
37
-
38
-
39
-
40
-
41
-
42
-
43
-
44
-
45
-
46
-
47
-
48
-
49
-
50
-
51
-
 52
52 -
 53
53 -
 54
54 -
 55
55 -
 56
56 -
 57
57 -
 58
58 -
 59
59 -
 60
60 -
 61
61 -
 62
62 -
 63
63 -
 64
64 -
 65
65 -
 66
66 -
 67
67 -
 68
68 -
 69
69 -
 70
70 -
 71
71 -
 72
72 -
73
-
74
-
75
-
76
-
77
-
78
-
79
-
80
-
81
-
82
-
83
-
84
-
85
-
86
-
87
-
88
-
89
-
90
-
91
-
92
-
93
-
94
-
95
-
96
-
97
-
98
-
99
-
100
-
101
-
102
-
103
-
104
-
105
-
106
-
107
-
108
-
109
-
110
-
111
-
112
-
113
-
114
-
115
-
116
-
117
-
118
-
119
-
120
-
121
-
122
-
123
-
124
-
125
-
126
-
127
-
128
-
129
-
130
-
131
-
132
-
133
-
134
-
135
-
136
-
137
-
138
-
139
-
140
-
141
-
142
-
143
-
144
-
145
-
146
-
147
-
148
-
149
-
150
-
151
-
152
-
153
-
154
-
155
-
156
-
157
-
158
-
159
-
160
-
161
-
162
-
163
-
164
-
165
-
166
-
167
-
168
-
169
-
170
-
171
-
172
-
173
-
174
-
175
-
176
-
177
-
178
-
179
-
180
-
181
-
182
-
183
-
184
-
185
-
186
-
187
-
188
-
189
-
190
-
191
-
192
-
193
-
194
-
195
-
196
-
197
-
198
-
199
-
200
-
201
-
202
-
203
-
204
-
205
-
206
-
207
-
208
-
209
-
210
-
211
-
212
-
213
-
214
-
215
-
216
-
217
-
218
-
219
-
220
-
221
-
222
-
223
-
224
-
225
-
226
-
227
-
228
-
229
-
230
-
231
-
232
 |
 |
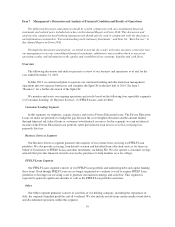
Key Financial Measures
Our operating results are primarily driven by net interest income from our student loan portfolios (which
include financing costs), provision for loan losses, the revenues and expenses generated by our service
businesses, and gains and losses on subsidiary sales, loan sales and debt repurchases. We manage and assess the
performance of each business segment separately as each is focused on different customers and each derives its
revenue from different activities and services. A brief summary of our key financial measures are listed below.
Net Interest Income
The most significant portion of our earnings is generated by the spread earned between the interest income
we receive on assets in our student loan portfolios and the interest expense on debt funding these loans. We
report these earnings as net interest income. Net interest income in our Consumer Lending and FFELP Loans
segments are driven by significantly different factors.
Consumer Lending Segment
Net interest income in this segment is determined by the balance of Private Education Loans outstanding
and Private Education Loan asset yields less our cost of funds. The asset yield is determined by interest rates we
establish based upon the credit of the customer and the level of price competition in the Private Education Loan
market. As of December 31, 2013, we had $37.5 billion of Private Education Loans outstanding. In 2013, we
originated $3.8 billion of Private Education Loans, up 14 percent from $3.3 billion in the prior year. The majority
of our Private Education Loans earn variable rate interest and are funded primarily with variable rate liabilities.
The Consumer Lending segment’s “Core Earnings” net interest margin was 4.16 percent in 2013 compared with
4.13 percent in 2012. Our cost of funds can be influenced by a number of factors, including the quality of the
loans in our portfolio, our corporate credit rating, general economic conditions, investor demand for Private
Education Loan asset-backed securities (“ABS”) and corporate unsecured debt and competition in the deposit
market. At December 31, 2013, 49 percent of our Private Education Loan portfolio was funded to term with non-
recourse, long-term securitization debt.
FFELP Loans Segment
Net interest income will be the primary source of cash flow generated by this segment over the next 20 years
as this portfolio amortizes. Interest earned on our FFELP Loans is indexed to one-month LIBOR rates and our
cost of funds is primarily indexed to three-month LIBOR, creating the possibility of basis and repricing risk
related to these assets. As of December 31, 2013, we had $104.6 billion of FFELP Loans outstanding. The
FFELP Loans segment’s “Core Earnings” net interest margin was 0.88 percent in 2013 compared with 0.84
percent in 2012.
The major source of variability in net interest income is expected to be Floor Income we earn on certain
FFELP Loans. Pursuant to the terms of the FFELP, certain FFELP Loans continue to earn interest at the stated
fixed rate of interest as underlying debt costs decrease. We refer to this additional spread income as “Floor
Income.” Floor Income can be volatile. We frequently hedge this volatility by selling Floor Income Contracts
which lock in the value of the Floor Income over the term of the contract.
At December 31, 2013, 84 percent of our FFELP Loan portfolio was funded to term with non-recourse,
long-term securitization debt.
Provisions for Loan Losses
Management estimates and maintains an allowance for loan losses at a level sufficient to cover charge-offs
expected over the next two years, plus an additional allowance to cover life-of-loan expected losses for loans
classified as a troubled debt restructuring (“TDR”). The provision for loan losses increases the related allowance
60