Sallie Mae 2013 Annual Report Download - page 78
Download and view the complete annual report
Please find page 78 of the 2013 Sallie Mae annual report below. You can navigate through the pages in the report by either clicking on the pages listed below, or by using the keyword search tool below to find specific information within the annual report.-
 1
1 -
2
-
3
-
4
-
5
-
6
-
7
-
8
-
9
-
10
-
11
-
12
-
13
-
14
-
15
-
16
-
17
-
18
-
19
-
20
-
21
-
22
-
23
-
24
-
25
-
26
-
27
-
28
-
29
-
30
-
31
-
32
-
33
-
34
-
35
-
36
-
37
-
38
-
39
-
40
-
41
-
42
-
43
-
44
-
45
-
46
-
47
-
48
-
49
-
50
-
51
-
52
-
53
-
54
-
55
-
56
-
57
-
58
-
59
-
60
-
61
-
62
-
63
-
64
-
65
-
66
-
67
-
 68
68 -
 69
69 -
 70
70 -
 71
71 -
 72
72 -
 73
73 -
 74
74 -
 75
75 -
 76
76 -
 77
77 -
 78
78 -
 79
79 -
 80
80 -
 81
81 -
 82
82 -
 83
83 -
 84
84 -
 85
85 -
 86
86 -
 87
87 -
 88
88 -
89
-
90
-
91
-
92
-
93
-
94
-
95
-
96
-
97
-
98
-
99
-
100
-
101
-
102
-
103
-
104
-
105
-
106
-
107
-
108
-
109
-
110
-
111
-
112
-
113
-
114
-
115
-
116
-
117
-
118
-
119
-
120
-
121
-
122
-
123
-
124
-
125
-
126
-
127
-
128
-
129
-
130
-
131
-
132
-
133
-
134
-
135
-
136
-
137
-
138
-
139
-
140
-
141
-
142
-
143
-
144
-
145
-
146
-
147
-
148
-
149
-
150
-
151
-
152
-
153
-
154
-
155
-
156
-
157
-
158
-
159
-
160
-
161
-
162
-
163
-
164
-
165
-
166
-
167
-
168
-
169
-
170
-
171
-
172
-
173
-
174
-
175
-
176
-
177
-
178
-
179
-
180
-
181
-
182
-
183
-
184
-
185
-
186
-
187
-
188
-
189
-
190
-
191
-
192
-
193
-
194
-
195
-
196
-
197
-
198
-
199
-
200
-
201
-
202
-
203
-
204
-
205
-
206
-
207
-
208
-
209
-
210
-
211
-
212
-
213
-
214
-
215
-
216
-
217
-
218
-
219
-
220
-
221
-
222
-
223
-
224
-
225
-
226
-
227
-
228
-
229
-
230
-
231
-
232
 |
 |

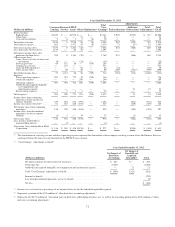
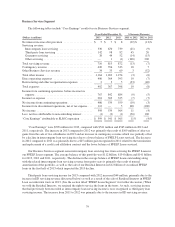
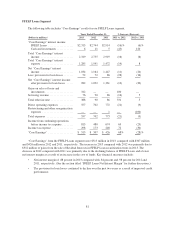
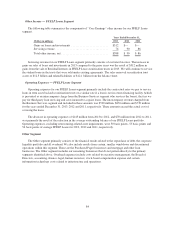
Business Segment Earnings Summary — “Core Earnings” Basis
Consumer Lending Segment
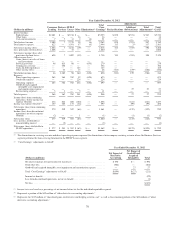
The following table includes “Core Earnings” results for our Consumer Lending segment.
Years Ended December 31, % Increase (Decrease)
(Dollars in millions) 2013 2012 2011 2013 vs. 2012 2012 vs. 2011
“Core Earnings” interest income:
Private Education Loans ........................ $2,527 $2,481 $2,429 2% 2%
Cash and investments ...........................779— (22)
Total “Core Earnings” interest income ............... 2,534 2,488 2,438 2 2
Total “Core Earnings” interest expense ............... 825 822 801 — 3
Net “Core Earnings” interest income ................. 1,709 1,666 1,637 3 2
Less: provision for loan losses ...................... 787 1,008 1,179 (22) (15)
Net “Core Earnings” interest income after provision for
loan losses ................................... 922 658 458 40 44
Losses on sales of loans and investments ............. — — (9) — (100)
Servicing revenue ................................ 34 46 64 (26) (28)
Total other income ............................... 34 46 55 (26) (16)
Direct operating expenses ......................... 298 265 291 12 (9)
Restructuring and other reorganization expenses .......633100 —
Total expenses .................................. 304 268 294 13 (9)
Income before income tax expense .................. 652 436 219 50 99
Income tax expense .............................. 239 157 81 52 94
Net income from continuing operations ............... 413 279 138 48 102
Loss from discontinued operations, net of tax benefit .... (1) (2) (2) (50) —
“Core Earnings” ................................. $ 412 $ 277 $ 136 49% 104%
“Core Earnings” were $412 million in 2013, compared with $277 million in 2012 and $136 million in 2011.
This increase across all years was primarily the result of lower provision for loan losses as well as an increase in
net interest income.
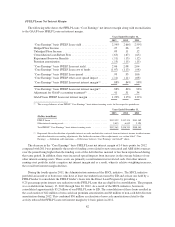
2013 highlights compared with 2012 included:
• Loan originations increased to $3.8 billion, up 14 percent from $3.3 billion.
• The portfolio, net of loan loss allowance, totaled $37.5 billion at December 31, 2013, compared with
$36.9 billion at December 31, 2012.
• Net interest margin, before loan loss provision, improved to 4.16 percent, up from 4.13 percent.
• Provision for Private Education Loan losses decreased to $787 million from $1.0 billion.
• Delinquencies of 90 days or more (as a percentage of loans in repayment) improved to 4.1 percent,
compared with 4.6 percent.
• Loans in forbearance decreased to 3.4 percent of loans in repayment and forbearance, down from 3.5
percent.
• The annual charge-off rate (as a percentage of loans in repayment) improved to 2.8 percent, compared
with 3.4 percent.
76