Sallie Mae 2013 Annual Report Download - page 127
Download and view the complete annual report
Please find page 127 of the 2013 Sallie Mae annual report below. You can navigate through the pages in the report by either clicking on the pages listed below, or by using the keyword search tool below to find specific information within the annual report.-
 1
1 -
2
-
3
-
4
-
5
-
6
-
7
-
8
-
9
-
10
-
11
-
12
-
13
-
14
-
15
-
16
-
17
-
18
-
19
-
20
-
21
-
22
-
23
-
24
-
25
-
26
-
27
-
28
-
29
-
30
-
31
-
32
-
33
-
34
-
35
-
36
-
37
-
38
-
39
-
40
-
41
-
42
-
43
-
44
-
45
-
46
-
47
-
48
-
49
-
50
-
51
-
52
-
53
-
54
-
55
-
56
-
57
-
58
-
59
-
60
-
61
-
62
-
63
-
64
-
65
-
66
-
67
-
68
-
69
-
70
-
71
-
72
-
73
-
74
-
75
-
76
-
77
-
78
-
79
-
80
-
81
-
82
-
83
-
84
-
85
-
86
-
87
-
88
-
89
-
90
-
91
-
92
-
93
-
94
-
95
-
96
-
97
-
98
-
99
-
100
-
101
-
102
-
103
-
104
-
105
-
106
-
107
-
108
-
109
-
110
-
111
-
112
-
113
-
114
-
115
-
116
-
 117
117 -
 118
118 -
 119
119 -
 120
120 -
 121
121 -
 122
122 -
 123
123 -
 124
124 -
 125
125 -
 126
126 -
 127
127 -
 128
128 -
 129
129 -
 130
130 -
 131
131 -
 132
132 -
 133
133 -
 134
134 -
 135
135 -
 136
136 -
 137
137 -
138
-
139
-
140
-
141
-
142
-
143
-
144
-
145
-
146
-
147
-
148
-
149
-
150
-
151
-
152
-
153
-
154
-
155
-
156
-
157
-
158
-
159
-
160
-
161
-
162
-
163
-
164
-
165
-
166
-
167
-
168
-
169
-
170
-
171
-
172
-
173
-
174
-
175
-
176
-
177
-
178
-
179
-
180
-
181
-
182
-
183
-
184
-
185
-
186
-
187
-
188
-
189
-
190
-
191
-
192
-
193
-
194
-
195
-
196
-
197
-
198
-
199
-
200
-
201
-
202
-
203
-
204
-
205
-
206
-
207
-
208
-
209
-
210
-
211
-
212
-
213
-
214
-
215
-
216
-
217
-
218
-
219
-
220
-
221
-
222
-
223
-
224
-
225
-
226
-
227
-
228
-
229
-
230
-
231
-
232
 |
 |

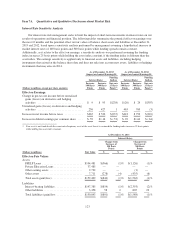
swaps in other assets or other liabilities. In the current economic environment, volatility in the spread between
spot and forward foreign exchange rates has resulted in material mark-to-market impacts to current-period
earnings which have not been factored into the above analysis. The earnings impact is noncash, and at maturity
of the instruments the cumulative mark-to-market impact will be zero.
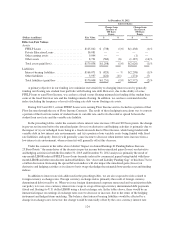
Asset and Liability Funding Gap
The tables below present our assets and liabilities (funding) arranged by underlying indices as of
December 31, 2013. In the following GAAP presentation, the funding gap only includes derivatives that qualify
as effective hedges (those derivatives which are reflected in net interest margin, as opposed to those reflected in
the “gains (losses) on derivatives and hedging activities, net” line on the consolidated statements of income). The
difference between the asset and the funding is the funding gap for the specified index. This represents our
exposure to interest rate risk in the form of basis risk and repricing risk, which is the risk that the different indices
may reset at different frequencies or may not move in the same direction or at the same magnitude.
Management analyzes interest rate risk and in doing so includes all derivatives that are economically
hedging our debt whether they qualify as effective hedges or not (“Core Earnings” basis). Accordingly, we are
also presenting the asset and liability funding gap on a “Core Earnings” basis in the table that follows the GAAP
presentation.
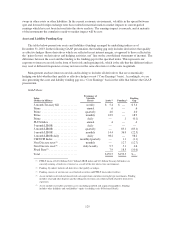
GAAP-Basis
Index
(Dollars in billions)
Frequency of
Variable
Resets Assets(1) Funding(2)
Funding
Gap
3-month Treasury bill ............ weekly $ 5.4 $ — $ 5.4
Prime ......................... annual .6 — .6
Prime ......................... quarterly 4.0 — 4.0
Prime ......................... monthly 18.9 — 18.9
Prime ......................... daily — .1 (0.1)
PLUS Index .................... annual .4 — .4
3-month LIBOR ................. daily — — —
3-month LIBOR ................. quarterly — 85.1 (85.1)
1-month LIBOR ................. monthly 14.4 36.9 (22.5)
1-month LIBOR daily ............ daily 98.2 — 98.2
CMT/CPI Index ................. monthly/quarterly — 1.1 (1.1)
Non-Discrete reset(3) ............. monthly — 12.7 (12.7)
Non-Discrete reset(4) ............. daily/weekly 9.7 5.1 4.6
Fixed Rate(5) .................... 7.9 18.5 (10.6)
Total .......................... $159.5 $159.5 $—
(1) FFELP Loans of $45.0 billion ($41.7 billion LIBOR index and $3.3 billion Treasury bill index) are
currently earning a fixed rate of interest as a result of the low interest rate environment.
(2) Funding (by index) includes all derivatives that qualify as hedges.
(3) Funding consists of auction rate asset-backed securities and FFELP Loan-other facilities.
(4) Assets include restricted and unrestricted cash equivalents and other overnight type instruments. Funding
includes retail and other deposits and the obligation to return cash collateral held related to derivatives
exposures.
(5) Assets include receivables and other assets (including goodwill and acquired intangibles). Funding
includes other liabilities and stockholders’ equity (excluding series B Preferred Stock).
125