Sallie Mae 2013 Annual Report Download - page 125
Download and view the complete annual report
Please find page 125 of the 2013 Sallie Mae annual report below. You can navigate through the pages in the report by either clicking on the pages listed below, or by using the keyword search tool below to find specific information within the annual report.-
 1
1 -
2
-
3
-
4
-
5
-
6
-
7
-
8
-
9
-
10
-
11
-
12
-
13
-
14
-
15
-
16
-
17
-
18
-
19
-
20
-
21
-
22
-
23
-
24
-
25
-
26
-
27
-
28
-
29
-
30
-
31
-
32
-
33
-
34
-
35
-
36
-
37
-
38
-
39
-
40
-
41
-
42
-
43
-
44
-
45
-
46
-
47
-
48
-
49
-
50
-
51
-
52
-
53
-
54
-
55
-
56
-
57
-
58
-
59
-
60
-
61
-
62
-
63
-
64
-
65
-
66
-
67
-
68
-
69
-
70
-
71
-
72
-
73
-
74
-
75
-
76
-
77
-
78
-
79
-
80
-
81
-
82
-
83
-
84
-
85
-
86
-
87
-
88
-
89
-
90
-
91
-
92
-
93
-
94
-
95
-
96
-
97
-
98
-
99
-
100
-
101
-
102
-
103
-
104
-
105
-
106
-
107
-
108
-
109
-
110
-
111
-
112
-
113
-
114
-
 115
115 -
 116
116 -
 117
117 -
 118
118 -
 119
119 -
 120
120 -
 121
121 -
 122
122 -
 123
123 -
 124
124 -
 125
125 -
 126
126 -
 127
127 -
 128
128 -
 129
129 -
 130
130 -
 131
131 -
 132
132 -
 133
133 -
 134
134 -
 135
135 -
136
-
137
-
138
-
139
-
140
-
141
-
142
-
143
-
144
-
145
-
146
-
147
-
148
-
149
-
150
-
151
-
152
-
153
-
154
-
155
-
156
-
157
-
158
-
159
-
160
-
161
-
162
-
163
-
164
-
165
-
166
-
167
-
168
-
169
-
170
-
171
-
172
-
173
-
174
-
175
-
176
-
177
-
178
-
179
-
180
-
181
-
182
-
183
-
184
-
185
-
186
-
187
-
188
-
189
-
190
-
191
-
192
-
193
-
194
-
195
-
196
-
197
-
198
-
199
-
200
-
201
-
202
-
203
-
204
-
205
-
206
-
207
-
208
-
209
-
210
-
211
-
212
-
213
-
214
-
215
-
216
-
217
-
218
-
219
-
220
-
221
-
222
-
223
-
224
-
225
-
226
-
227
-
228
-
229
-
230
-
231
-
232
 |
 |

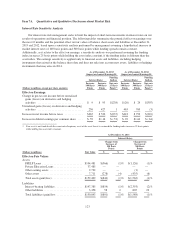
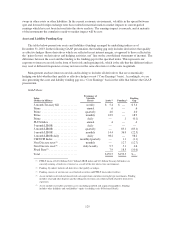
Item 7A. Quantitative and Qualitative Disclosures about Market Risk
Interest Rate Sensitivity Analysis
Our interest rate risk management seeks to limit the impact of short-term movements in interest rates on our
results of operations and financial position. The following tables summarize the potential effect on earnings over
the next 12 months and the potential effect on fair values of balance sheet assets and liabilities at December 31,
2013 and 2012, based upon a sensitivity analysis performed by management assuming a hypothetical increase in
market interest rates of 100 basis points and 300 basis points while funding spreads remain constant.
Additionally, as it relates to the effect on earnings, a sensitivity analysis was performed assuming the funding
index increases 25 basis points while holding the asset index constant, if the funding index is different than the
asset index. The earnings sensitivity is applied only to financial assets and liabilities, including hedging
instruments that existed at the balance sheet date and does not take into account new assets, liabilities or hedging
instruments that may arise in 2014.
As of December 31, 2013
Impact on Annual Earnings If:
As of December 31, 2012
Impact on Annual Earnings If:
Interest Rates:
Funding
Indices Interest Rates:
Funding
Indices
(Dollars in millions, except per share amounts)
Increase
100 Basis
Points
Increase
300 Basis
Points
Increase
25 Basis
Points(1)
Increase
100 Basis
Points
Increase
300 Basis
Points
Increase
25 Basis
Points(1)
Effect on Earnings:
Change in pre-tax net income before unrealized
gains (losses) on derivative and hedging
activities ................................ $ 9 $ 93 $(238) $ (20) $ 24 $(307)
Unrealized gains (losses) on derivative and hedging
activities ................................ 256 427 1 463 769 (3)
Increase in net income before taxes ............. $265 $ 520 $(237) $443 $ 793 $(310)
Increase in diluted earnings per common share .... $.59 $1.16 $ (.53) $ .92 $1.64 $ (.64)
(1) If an asset is not funded with the same index/frequency reset of the asset then it is assumed the funding index increases 25 basis points
while holding the asset index constant.
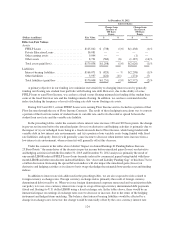
At December 31, 2013
Fair Value
Interest Rates:
Change from
Increase of
100 Basis
Points
Change from
Increase of
300 Basis
Points
(Dollars in millions) $ % $ %
Effect on Fair Values
Assets
FFELP Loans ............................ $104,481 $(566) (1)% $(1,126) (1)%
Private Education Loans .................... 37,485 — — — —
Other earning assets ....................... 9,732 — — (1) —
Other assets ............................. 7,711 (278) (4) (435) (6)
Total assets gain/(loss) ..................... $159,409 $(844) (1)% $(1,562) (1)%
Liabilities
Interest-bearing liabilities ................... $147,385 $(859) (1)% $(2,393) (2)%
Other liabilities ........................... 3,458 58 2 805 23
Total liabilities (gain)/loss .................. $150,843 $(801) (1)% $(1,588) (1)%
123