Sallie Mae 2013 Annual Report Download - page 178
Download and view the complete annual report
Please find page 178 of the 2013 Sallie Mae annual report below. You can navigate through the pages in the report by either clicking on the pages listed below, or by using the keyword search tool below to find specific information within the annual report.-
 1
1 -
2
-
3
-
4
-
5
-
6
-
7
-
8
-
9
-
10
-
11
-
12
-
13
-
14
-
15
-
16
-
17
-
18
-
19
-
20
-
21
-
22
-
23
-
24
-
25
-
26
-
27
-
28
-
29
-
30
-
31
-
32
-
33
-
34
-
35
-
36
-
37
-
38
-
39
-
40
-
41
-
42
-
43
-
44
-
45
-
46
-
47
-
48
-
49
-
50
-
51
-
52
-
53
-
54
-
55
-
56
-
57
-
58
-
59
-
60
-
61
-
62
-
63
-
64
-
65
-
66
-
67
-
68
-
69
-
70
-
71
-
72
-
73
-
74
-
75
-
76
-
77
-
78
-
79
-
80
-
81
-
82
-
83
-
84
-
85
-
86
-
87
-
88
-
89
-
90
-
91
-
92
-
93
-
94
-
95
-
96
-
97
-
98
-
99
-
100
-
101
-
102
-
103
-
104
-
105
-
106
-
107
-
108
-
109
-
110
-
111
-
112
-
113
-
114
-
115
-
116
-
117
-
118
-
119
-
120
-
121
-
122
-
123
-
124
-
125
-
126
-
127
-
128
-
129
-
130
-
131
-
132
-
133
-
134
-
135
-
136
-
137
-
138
-
139
-
140
-
141
-
142
-
143
-
144
-
145
-
146
-
147
-
148
-
149
-
150
-
151
-
152
-
153
-
154
-
155
-
156
-
157
-
158
-
159
-
160
-
161
-
162
-
163
-
164
-
165
-
166
-
167
-
 168
168 -
 169
169 -
 170
170 -
 171
171 -
 172
172 -
 173
173 -
 174
174 -
 175
175 -
 176
176 -
 177
177 -
 178
178 -
 179
179 -
 180
180 -
 181
181 -
 182
182 -
 183
183 -
 184
184 -
 185
185 -
 186
186 -
 187
187 -
 188
188 -
189
-
190
-
191
-
192
-
193
-
194
-
195
-
196
-
197
-
198
-
199
-
200
-
201
-
202
-
203
-
204
-
205
-
206
-
207
-
208
-
209
-
210
-
211
-
212
-
213
-
214
-
215
-
216
-
217
-
218
-
219
-
220
-
221
-
222
-
223
-
224
-
225
-
226
-
227
-
228
-
229
-
230
-
231
-
232
 |
 |

SLM CORPORATION
NOTES TO CONSOLIDATED FINANCIAL STATEMENTS (Continued)
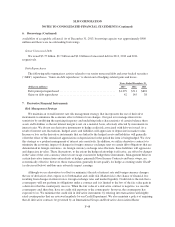
5. Goodwill and Acquired Intangible Assets (Continued)
To assess impairment for the FFELP, Consumer Lending, and Servicing reporting units at October 1, 2012
and 2011, we assessed relevant qualitative factors to determine whether it was “more-likely-than-not” that the
fair value of an individual reporting unit was less than its carrying value. These qualitative factors included
consideration of the significant amount of excess fair value over the carrying values of these reporting units as of
October 1, 2010 when we performed a Step 1 goodwill impairment test and engaged an appraisal firm to estimate
the fair values of these reporting units, the current legislative environment, our stock price during 2012 and 2011,
market capitalization and EPS results as well as significant reductions in our operating expenses. After assessing
these relevant qualitative factors, we determined that it was more-likely-than-not that the fair values of these
reporting units exceeded their carrying amounts.
During 2012, we finalized the purchase accounting for a Contingency Services acquisition that resulted in
goodwill. We performed Step 1 impairment testing for the Contingency Services reporting unit as of October 1,
2012, resulting in no indicated impairment.
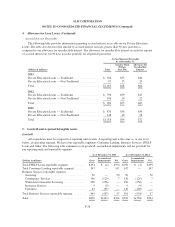
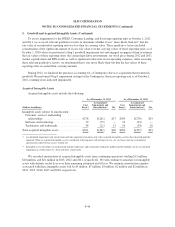
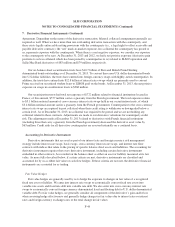
Acquired Intangible Assets
Acquired intangible assets include the following:
As of December 31, 2013 As of December 31, 2012
(Dollars in millions)
Cost
Basis(1)
Accumulated
Impairment and
Amortization(1) Net
Cost
Basis(1)
Accumulated
Impairment and
Amortization(1) Net
Intangible assets subject to amortization:
Customer, services and lending
relationships ......................... $278 $(261) $17 $303 $(270) $33
Software and technology ................. 79 (79) — 93 (93) —
Tradenames and trademarks ............... 34 (21) 13 54 (34) 20
Total acquired intangible assets .............. $391 $(361) $30 $450 $(397) $53
(1) Accumulated impairment and amortization includes impairment amounts only if the acquired intangible asset has been deemed partially
impaired. When an acquired intangible asset is considered fully impaired, and no longer in use, the cost basis and any accumulated
amortization related to the asset is written off.
(2) Intangible assets not subject to amortization include tradenames and trademarks totaling $6 million and $10 million, net of accumulated
impairment as of December 31, 2013 and 2012, respectively.
We recorded amortization of acquired intangible assets from continuing operations totaling $13 million,
$18 million, and $21 million in 2013, 2012 and 2011, respectively. We will continue to amortize our intangible
assets with definite useful lives over their remaining estimated useful lives. We estimate amortization expense
associated with these intangible assets will be $9 million, $7 million, $5 million, $2 million and $2 million in
2014, 2015, 2016, 2017 and 2018, respectively.
F-40