Sallie Mae 2013 Annual Report Download - page 182
Download and view the complete annual report
Please find page 182 of the 2013 Sallie Mae annual report below. You can navigate through the pages in the report by either clicking on the pages listed below, or by using the keyword search tool below to find specific information within the annual report.-
 1
1 -
2
-
3
-
4
-
5
-
6
-
7
-
8
-
9
-
10
-
11
-
12
-
13
-
14
-
15
-
16
-
17
-
18
-
19
-
20
-
21
-
22
-
23
-
24
-
25
-
26
-
27
-
28
-
29
-
30
-
31
-
32
-
33
-
34
-
35
-
36
-
37
-
38
-
39
-
40
-
41
-
42
-
43
-
44
-
45
-
46
-
47
-
48
-
49
-
50
-
51
-
52
-
53
-
54
-
55
-
56
-
57
-
58
-
59
-
60
-
61
-
62
-
63
-
64
-
65
-
66
-
67
-
68
-
69
-
70
-
71
-
72
-
73
-
74
-
75
-
76
-
77
-
78
-
79
-
80
-
81
-
82
-
83
-
84
-
85
-
86
-
87
-
88
-
89
-
90
-
91
-
92
-
93
-
94
-
95
-
96
-
97
-
98
-
99
-
100
-
101
-
102
-
103
-
104
-
105
-
106
-
107
-
108
-
109
-
110
-
111
-
112
-
113
-
114
-
115
-
116
-
117
-
118
-
119
-
120
-
121
-
122
-
123
-
124
-
125
-
126
-
127
-
128
-
129
-
130
-
131
-
132
-
133
-
134
-
135
-
136
-
137
-
138
-
139
-
140
-
141
-
142
-
143
-
144
-
145
-
146
-
147
-
148
-
149
-
150
-
151
-
152
-
153
-
154
-
155
-
156
-
157
-
158
-
159
-
160
-
161
-
162
-
163
-
164
-
165
-
166
-
167
-
168
-
169
-
170
-
171
-
 172
172 -
 173
173 -
 174
174 -
 175
175 -
 176
176 -
 177
177 -
 178
178 -
 179
179 -
 180
180 -
 181
181 -
 182
182 -
 183
183 -
 184
184 -
 185
185 -
 186
186 -
 187
187 -
 188
188 -
 189
189 -
 190
190 -
 191
191 -
 192
192 -
193
-
194
-
195
-
196
-
197
-
198
-
199
-
200
-
201
-
202
-
203
-
204
-
205
-
206
-
207
-
208
-
209
-
210
-
211
-
212
-
213
-
214
-
215
-
216
-
217
-
218
-
219
-
220
-
221
-
222
-
223
-
224
-
225
-
226
-
227
-
228
-
229
-
230
-
231
-
232
 |
 |
SLM CORPORATION
NOTES TO CONSOLIDATED FINANCIAL STATEMENTS (Continued)
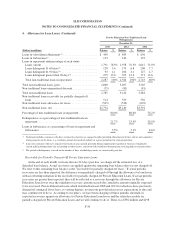
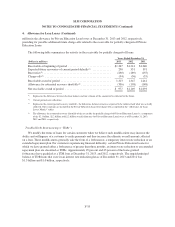
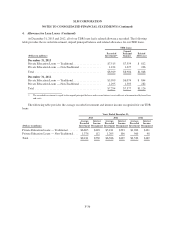
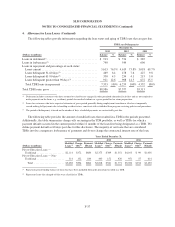
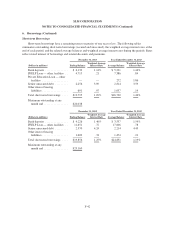
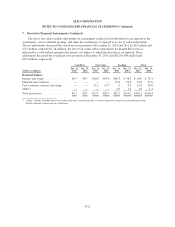
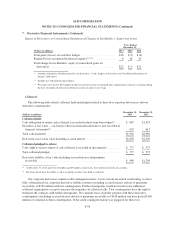
6. Borrowings (Continued)
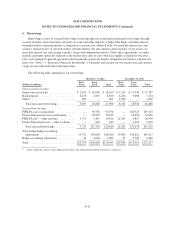
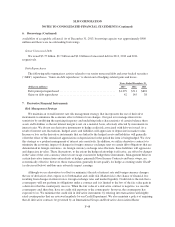
At December 31, 2013, we had outstanding long-term borrowings with call features totaling $1.7 billion. In
addition, we have $6.2 billion of pre-payable debt related to our secured facilities. Generally, these instruments
are callable at the par amount. As of December 31, 2013, the stated maturities and maturities if accelerated to the
call dates are shown in the following table.
December 31, 2013
Stated Maturity(1) Maturity to Call Date(1)
(Dollars in millions)
Senior
Unsecured
Debt
Brokered
Deposits
Secured
Borrowings Total(2)
Senior
Unsecured
Debt
Brokered
Deposits
Secured
Borrowings Total
Year of Maturity
2014 ........... $ — $ — $ 14,408 $ 14,408 $ 1,611 $ — $ 14,408 $ 16,019
2015 ........... 1,506 1,195 11,672 14,373 1,595 1,195 11,672 14,462
2016 ........... 2,284 648 9,498 12,430 2,283 648 9,498 12,429
2017 ........... 1,829 538 10,157 12,524 1,807 538 10,157 12,502
2018 ........... 2,796 426 8,597 11,819 2,547 426 8,597 11,570
2019 and after . . . 7,641 — 61,413 69,054 6,213 — 61,413 67,626
16,056 2,807 115,745 134,608 16,056 2,807 115,745 134,608
Hedge accounting
adjustments . . . 727 — 1,313 2,040 727 — 1,313 2,040
Total .......... $16,783 $2,807 $117,058 $136,648 $16,783 $2,807 $117,058 $136,648
(1) We view our securitization trust debt as long-term based on the contractual maturity dates and projected principal paydowns based on our
current estimates regarding loan prepayment speeds. The projected principal paydowns in year 2014 include $14.4 billion related to the
securitization trust debt.
(2) The aggregate principal amount of debt that matures in each period is $14.5 billion in 2014, $14.4 billion in 2015, $12.5 billion in 2016,
$12.6 billion in 2017, $11.9 billion in 2018, and $69.6 billion in 2019 and after.
F-44