Sallie Mae 2013 Annual Report Download - page 107
Download and view the complete annual report
Please find page 107 of the 2013 Sallie Mae annual report below. You can navigate through the pages in the report by either clicking on the pages listed below, or by using the keyword search tool below to find specific information within the annual report.-
 1
1 -
2
-
3
-
4
-
5
-
6
-
7
-
8
-
9
-
10
-
11
-
12
-
13
-
14
-
15
-
16
-
17
-
18
-
19
-
20
-
21
-
22
-
23
-
24
-
25
-
26
-
27
-
28
-
29
-
30
-
31
-
32
-
33
-
34
-
35
-
36
-
37
-
38
-
39
-
40
-
41
-
42
-
43
-
44
-
45
-
46
-
47
-
48
-
49
-
50
-
51
-
52
-
53
-
54
-
55
-
56
-
57
-
58
-
59
-
60
-
61
-
62
-
63
-
64
-
65
-
66
-
67
-
68
-
69
-
70
-
71
-
72
-
73
-
74
-
75
-
76
-
77
-
78
-
79
-
80
-
81
-
82
-
83
-
84
-
85
-
86
-
87
-
88
-
89
-
90
-
91
-
92
-
93
-
94
-
95
-
96
-
 97
97 -
 98
98 -
 99
99 -
 100
100 -
 101
101 -
 102
102 -
 103
103 -
 104
104 -
 105
105 -
 106
106 -
 107
107 -
 108
108 -
 109
109 -
 110
110 -
 111
111 -
 112
112 -
 113
113 -
 114
114 -
 115
115 -
 116
116 -
 117
117 -
118
-
119
-
120
-
121
-
122
-
123
-
124
-
125
-
126
-
127
-
128
-
129
-
130
-
131
-
132
-
133
-
134
-
135
-
136
-
137
-
138
-
139
-
140
-
141
-
142
-
143
-
144
-
145
-
146
-
147
-
148
-
149
-
150
-
151
-
152
-
153
-
154
-
155
-
156
-
157
-
158
-
159
-
160
-
161
-
162
-
163
-
164
-
165
-
166
-
167
-
168
-
169
-
170
-
171
-
172
-
173
-
174
-
175
-
176
-
177
-
178
-
179
-
180
-
181
-
182
-
183
-
184
-
185
-
186
-
187
-
188
-
189
-
190
-
191
-
192
-
193
-
194
-
195
-
196
-
197
-
198
-
199
-
200
-
201
-
202
-
203
-
204
-
205
-
206
-
207
-
208
-
209
-
210
-
211
-
212
-
213
-
214
-
215
-
216
-
217
-
218
-
219
-
220
-
221
-
222
-
223
-
224
-
225
-
226
-
227
-
228
-
229
-
230
-
231
-
232
 |
 |

primarily focus on NewCo’s lack of future Private Student Loan originations and related servicing income, the
loss of access to the earnings, cash flow, equity and potential market value of Sallie Mae Bank, the run-off of the
FFELP Loan portfolio and strategic uncertainty as to the source of incremental earnings and cash flow to replace
that in run-off, and an expected increase in our cost of accessing the unsecured debt markets, including for
refinancing purposes.
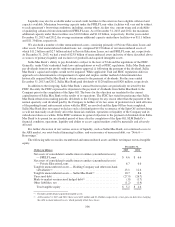
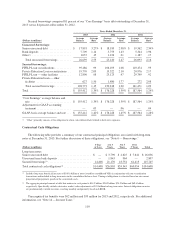
We expect to fund our ongoing liquidity needs, including the origination of new Private Education Loans
and the repayment of $2.2 billion of senior unsecured notes that mature in the next twelve months, primarily
through our current cash and investment portfolio, the issuance of additional bank deposits and unsecured debt,
the predictable operating cash flows provided by earnings, the repayment of principal on unencumbered student
loan assets and the distributions from our securitization trusts (including servicing fees which are priority
payments within the trusts). We may also draw down on our secured FFELP facilities; we may also issue term
ABS.
Currently, new Private Education Loan originations are initially funded through deposits and subsequently
securitized to term. We have $2.3 billion of cash at Sallie Mae Bank as of December 31, 2013 available to fund
future originations. We no longer originate FFELP Loans and therefore no longer have liquidity requirements for
new FFELP Loan originations, but will continue to opportunistically purchase FFELP Loan portfolios from
others.
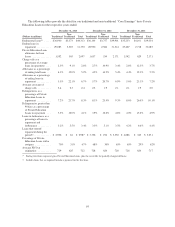
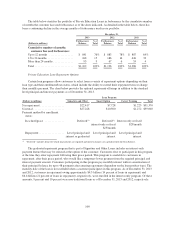
Sources of Liquidity and Available Capacity
Ending Balances
December 31,
(Dollars in millions) 2013 2012
Sources of primary liquidity:
Unrestricted cash and liquid investments:
Holding Company and other non-bank subsidiaries ............. $3,015 $2,376
Sallie Mae Bank(1) ....................................... 2,284 1,598
Total unrestricted cash and liquid investments ................... $5,299 $3,974
Unencumbered FFELP Loans:
Holding Company and other non-bank subsidiaries ............. $1,259 $ 612
Sallie Mae Bank ........................................ 1,425 1,044
Total unencumbered FFELP Loans ............................ $2,684 $1,656
Average Balances
Years Ended December 31,
(Dollars in millions) 2013 2012 2011
Sources of primary liquidity:
Unrestricted cash and liquid investments:
Holding Company and other non-bank subsidiaries ............ $2,475 $2,386 $2,474
Sallie Mae Bank(1) ...................................... 1,582 913 1,244
Total unrestricted cash and liquid investments .................. $4,057 $3,299 $3,718
Unencumbered FFELP Loans:
Holding Company and other non-bank subsidiaries ............ $ 837 $ 691 $1,201
Sallie Mae Bank ........................................ 1,141 527 198
Total unencumbered FFELP Loans ........................... $1,978 $1,218 $1,399
(1) This amount will be used primarily to originate or acquire student loans at Sallie Mae Bank. See discussion below on restrictions on
Sallie Mae Bank to pay dividends.
105