Sallie Mae 2013 Annual Report Download - page 212
Download and view the complete annual report
Please find page 212 of the 2013 Sallie Mae annual report below. You can navigate through the pages in the report by either clicking on the pages listed below, or by using the keyword search tool below to find specific information within the annual report.-
 1
1 -
2
-
3
-
4
-
5
-
6
-
7
-
8
-
9
-
10
-
11
-
12
-
13
-
14
-
15
-
16
-
17
-
18
-
19
-
20
-
21
-
22
-
23
-
24
-
25
-
26
-
27
-
28
-
29
-
30
-
31
-
32
-
33
-
34
-
35
-
36
-
37
-
38
-
39
-
40
-
41
-
42
-
43
-
44
-
45
-
46
-
47
-
48
-
49
-
50
-
51
-
52
-
53
-
54
-
55
-
56
-
57
-
58
-
59
-
60
-
61
-
62
-
63
-
64
-
65
-
66
-
67
-
68
-
69
-
70
-
71
-
72
-
73
-
74
-
75
-
76
-
77
-
78
-
79
-
80
-
81
-
82
-
83
-
84
-
85
-
86
-
87
-
88
-
89
-
90
-
91
-
92
-
93
-
94
-
95
-
96
-
97
-
98
-
99
-
100
-
101
-
102
-
103
-
104
-
105
-
106
-
107
-
108
-
109
-
110
-
111
-
112
-
113
-
114
-
115
-
116
-
117
-
118
-
119
-
120
-
121
-
122
-
123
-
124
-
125
-
126
-
127
-
128
-
129
-
130
-
131
-
132
-
133
-
134
-
135
-
136
-
137
-
138
-
139
-
140
-
141
-
142
-
143
-
144
-
145
-
146
-
147
-
148
-
149
-
150
-
151
-
152
-
153
-
154
-
155
-
156
-
157
-
158
-
159
-
160
-
161
-
162
-
163
-
164
-
165
-
166
-
167
-
168
-
169
-
170
-
171
-
172
-
173
-
174
-
175
-
176
-
177
-
178
-
179
-
180
-
181
-
182
-
183
-
184
-
185
-
186
-
187
-
188
-
189
-
190
-
191
-
192
-
193
-
194
-
195
-
196
-
197
-
198
-
199
-
200
-
201
-
 202
202 -
 203
203 -
 204
204 -
 205
205 -
 206
206 -
 207
207 -
 208
208 -
 209
209 -
 210
210 -
 211
211 -
 212
212 -
 213
213 -
 214
214 -
 215
215 -
 216
216 -
 217
217 -
 218
218 -
 219
219 -
 220
220 -
 221
221 -
 222
222 -
223
-
224
-
225
-
226
-
227
-
228
-
229
-
230
-
231
-
232
 |
 |
SLM CORPORATION
NOTES TO CONSOLIDATED FINANCIAL STATEMENTS (Continued)
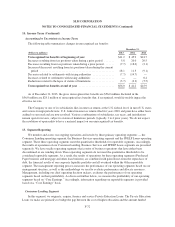
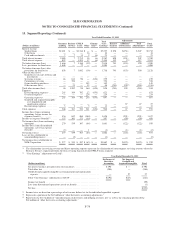
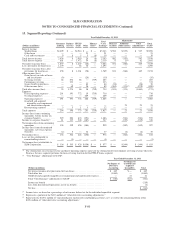
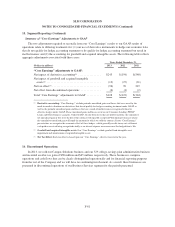
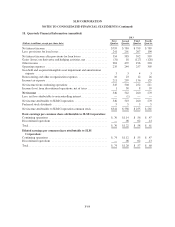
15. Segment Reporting (Continued)
behalf of Guarantors of FFELP Loans and other institutions, including the ED. With the elimination of FFELP in
July 2010, these FFELP-related revenue sources will continue to decline.
• Servicing revenues from the FFELP Loans we own and manage represent intercompany charges to the
FFELP Loans segment at rates paid to us by the trusts which own the loans. These fees are legally the
first payment priority of the trusts and exceed the actual cost of servicing the loans. Intercompany loan
servicing revenues declined to $530 million in 2013 from $670 million in 2012. Intercompany loan
servicing revenues will decline as the FFELP portfolio amortizes. Prepayments of FFELP Loans could
further accelerate the rate of decline.
• In 2013, we earned account maintenance fees on FFELP Loans serviced for Guarantors of $38 million,
down from $44 million in 2012. These fees will continue to decline as the portfolio amortizes.
Prepayments of FFELP Loans could further accelerate the rate of decline.
• We provide default aversion, post default collections and claims processing to 15 of the 30 Guarantor
agencies that serve as an intermediary between the U.S. federal government and FFELP lenders and are
responsible for paying the claims made on defaulted loans. In 2013, collection revenue from Guarantor
clients totaled $303 million, compared to $264 million the prior year. As FFELP Loans are no longer
originated, these revenues will generally decline over time unless we acquire additional work for
Guarantor clients. The rate at which these revenues will decrease will also be affected by the Bipartisan
Budget Act (the “Budget Act”) enacted on December 26, 2013 and effective on July 1, 2014, which
reduces the amount to be paid to Guarantor agencies for defaulted FFELP Loans that are rehabilitated
under Section 428F of the Higher Education Act (the “HEA”). The precise effect of the Budget Act will
depend on the decisions of our Guarantor agency clients about their continued participation in FFELP
default collections, as well as by how the fee reduction is implemented by ED. We earned approximately
$283 million in fee income from these activities in 2013.
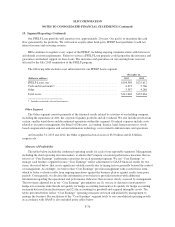
In 2013, FFELP-related revenues accounted for 77 percent of total Business Services segment revenues, as
compared with 82 percent and 82 percent, respectively, for the previous two years. Total Business Services
segment revenues were $1.16 billion for the year ended December 31, 2013, down from $1.20 billion for the
prior year.
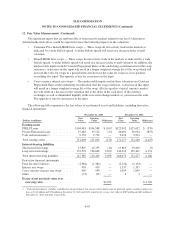
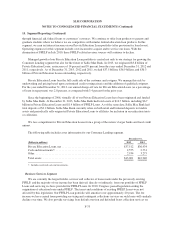
ED Collection and Servicing Contracts
Since 1997, we have provided collection services on defaulted student loans to ED. The current contract
runs through April 21, 2015. There are 21 other collection providers, of which we compete with 16 providers for
account allocation based on quarterly performance metrics. The remaining five providers are small businesses
that are ensured a particular allocation of business. As a consistent top performer, our share of allocated accounts
has ranged from six percent to eight percent for this contract period. Currently, we are participating in ED’s
procurement process for a new debt collection contract and expect them to announce the recipients by April 30,
2014.
Since the second quarter of 2009, we have been one of four large servicers awarded a servicing contract by
ED to service Direct Student Loan Program (“DSLP”) federal loans owned by ED. We serviced approximately
5.7 million accounts under this DSLP servicing contract as of December 31, 2013. The DSLP servicing contract
spans five years with one five-year renewal at the option of ED. In November 2013, ED gave notice to Sallie
Mae of its intent to exercise its five-year renewal option to extend the DSLP servicing contract. As such, we will
continue to compete for DSLP servicing volume from ED with the three other large servicing companies that also
have similar contracts. New account allocations for the upcoming contract year are awarded annually based on
each company’s performance on five different metrics over the most recently ended contract year: defaulted
F-74