Sallie Mae 2013 Annual Report Download - page 82
Download and view the complete annual report
Please find page 82 of the 2013 Sallie Mae annual report below. You can navigate through the pages in the report by either clicking on the pages listed below, or by using the keyword search tool below to find specific information within the annual report.-
 1
1 -
2
-
3
-
4
-
5
-
6
-
7
-
8
-
9
-
10
-
11
-
12
-
13
-
14
-
15
-
16
-
17
-
18
-
19
-
20
-
21
-
22
-
23
-
24
-
25
-
26
-
27
-
28
-
29
-
30
-
31
-
32
-
33
-
34
-
35
-
36
-
37
-
38
-
39
-
40
-
41
-
42
-
43
-
44
-
45
-
46
-
47
-
48
-
49
-
50
-
51
-
52
-
53
-
54
-
55
-
56
-
57
-
58
-
59
-
60
-
61
-
62
-
63
-
64
-
65
-
66
-
67
-
68
-
69
-
70
-
71
-
 72
72 -
 73
73 -
 74
74 -
 75
75 -
 76
76 -
 77
77 -
 78
78 -
 79
79 -
 80
80 -
 81
81 -
 82
82 -
 83
83 -
 84
84 -
 85
85 -
 86
86 -
 87
87 -
 88
88 -
 89
89 -
 90
90 -
 91
91 -
 92
92 -
93
-
94
-
95
-
96
-
97
-
98
-
99
-
100
-
101
-
102
-
103
-
104
-
105
-
106
-
107
-
108
-
109
-
110
-
111
-
112
-
113
-
114
-
115
-
116
-
117
-
118
-
119
-
120
-
121
-
122
-
123
-
124
-
125
-
126
-
127
-
128
-
129
-
130
-
131
-
132
-
133
-
134
-
135
-
136
-
137
-
138
-
139
-
140
-
141
-
142
-
143
-
144
-
145
-
146
-
147
-
148
-
149
-
150
-
151
-
152
-
153
-
154
-
155
-
156
-
157
-
158
-
159
-
160
-
161
-
162
-
163
-
164
-
165
-
166
-
167
-
168
-
169
-
170
-
171
-
172
-
173
-
174
-
175
-
176
-
177
-
178
-
179
-
180
-
181
-
182
-
183
-
184
-
185
-
186
-
187
-
188
-
189
-
190
-
191
-
192
-
193
-
194
-
195
-
196
-
197
-
198
-
199
-
200
-
201
-
202
-
203
-
204
-
205
-
206
-
207
-
208
-
209
-
210
-
211
-
212
-
213
-
214
-
215
-
216
-
217
-
218
-
219
-
220
-
221
-
222
-
223
-
224
-
225
-
226
-
227
-
228
-
229
-
230
-
231
-
232
 |
 |

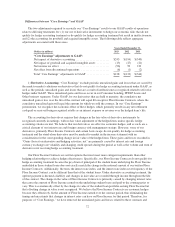
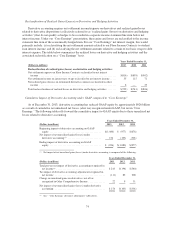
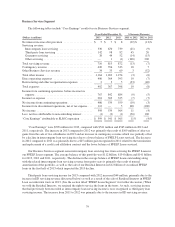
We serviced approximately 5.7 million accounts under the ED Servicing Contract as of December 31, 2013,
compared with 4.3 million accounts and 3.6 million accounts serviced at December 31, 2012 and 2011,
respectively. Third-party loan servicing fees in the years ended December 31, 2013, 2012 and 2011 included
$109 million, $84 million and $63 million, respectively, of servicing revenue related to the ED Servicing
Contract.
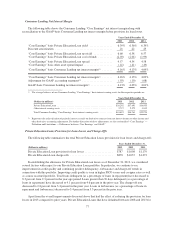
At December 31, 2013, we serviced over $300 billion principal balance of student loans compared with
approximately $250 billion serviced at December 31, 2012. The increase in the principal balance serviced in
2013 was primarily due to the growth in the ED serviced accounts discussed above.
Our contingency revenue consists of fees we receive for the collections of delinquent debt on behalf of
third-party clients performed on a contingent basis. Contingency revenue increased $64 million in 2013
compared with 2012 and increased $23 million in 2012 compared to 2011 as a result of the higher volume of
collections.
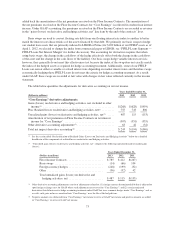
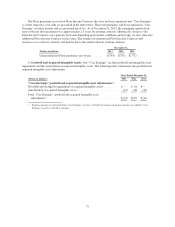
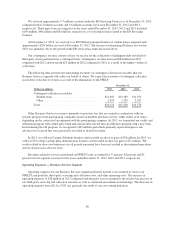
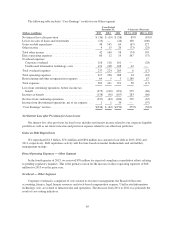
The following table presents the outstanding inventory of contingent collection receivables that our
Business Services segment will collect on behalf of others. We expect the inventory of contingent collection
receivables to decline over time as a result of the elimination of the FFELP.
December 31,
(Dollars in millions) 2013 2012 2011
Contingent collection receivables:
Student loans ................................. $13,481 $13,189 $11,553
Other ........................................ 2,693 2,139 2,017
Total .......................................... $16,174 $15,328 $13,570
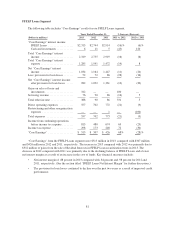
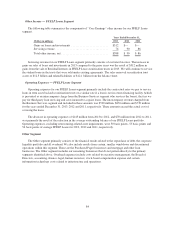
Other Business Services revenue is primarily transaction fees that are earned in conjunction with our
rewards program from participating companies based on member purchase activity, either online or in stores,
depending on the contractual arrangement with the participating company. In 2011, we terminated our credit card
affiliation program with a third-party bank and concurrently entered into an affiliation program with a new bank.
In terminating the old program, we recognized a $25 million gain which primarily represented prior cash
advances we received that were previously recorded as deferred revenue.
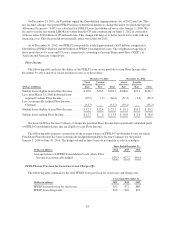
In 2013, we sold our Campus Solutions business and recorded an after-tax gain of $38 million. In 2013, we
sold our 529 college-savings plan administration business and recorded an after-tax gain of $71 million. The
results related to these two businesses for all periods presented have been reclassified as discontinued operations
and are shown on an after-tax basis.
Revenues related to services performed on FFELP Loans accounted for 77 percent, 82 percent and 82
percent of total segment revenues for the years ended December 31, 2013, 2012 and 2011, respectively.
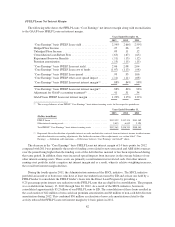
Operating Expenses — Business Services Segment
Operating expenses for our Business Services segment primarily include costs incurred to service our
FFELP Loan portfolio, third-party servicing and collection costs, and other operating costs. The increase in
operating expenses of $36 million in 2013 compared with the prior year was primarily the result of an increase in
our third-party servicing and collection activities as well as continued investments in technology. The decrease in
operating expenses from 2011 to 2012 was primarily the result of our cost-cutting initiatives.
80