Sallie Mae 2013 Annual Report Download - page 43
Download and view the complete annual report
Please find page 43 of the 2013 Sallie Mae annual report below. You can navigate through the pages in the report by either clicking on the pages listed below, or by using the keyword search tool below to find specific information within the annual report.-
 1
1 -
2
-
3
-
4
-
5
-
6
-
7
-
8
-
9
-
10
-
11
-
12
-
13
-
14
-
15
-
16
-
17
-
18
-
19
-
20
-
21
-
22
-
23
-
24
-
25
-
26
-
27
-
28
-
29
-
30
-
31
-
32
-
 33
33 -
 34
34 -
 35
35 -
 36
36 -
 37
37 -
 38
38 -
 39
39 -
 40
40 -
 41
41 -
 42
42 -
 43
43 -
 44
44 -
 45
45 -
 46
46 -
 47
47 -
 48
48 -
 49
49 -
 50
50 -
 51
51 -
 52
52 -
 53
53 -
54
-
55
-
56
-
57
-
58
-
59
-
60
-
61
-
62
-
63
-
64
-
65
-
66
-
67
-
68
-
69
-
70
-
71
-
72
-
73
-
74
-
75
-
76
-
77
-
78
-
79
-
80
-
81
-
82
-
83
-
84
-
85
-
86
-
87
-
88
-
89
-
90
-
91
-
92
-
93
-
94
-
95
-
96
-
97
-
98
-
99
-
100
-
101
-
102
-
103
-
104
-
105
-
106
-
107
-
108
-
109
-
110
-
111
-
112
-
113
-
114
-
115
-
116
-
117
-
118
-
119
-
120
-
121
-
122
-
123
-
124
-
125
-
126
-
127
-
128
-
129
-
130
-
131
-
132
-
133
-
134
-
135
-
136
-
137
-
138
-
139
-
140
-
141
-
142
-
143
-
144
-
145
-
146
-
147
-
148
-
149
-
150
-
151
-
152
-
153
-
154
-
155
-
156
-
157
-
158
-
159
-
160
-
161
-
162
-
163
-
164
-
165
-
166
-
167
-
168
-
169
-
170
-
171
-
172
-
173
-
174
-
175
-
176
-
177
-
178
-
179
-
180
-
181
-
182
-
183
-
184
-
185
-
186
-
187
-
188
-
189
-
190
-
191
-
192
-
193
-
194
-
195
-
196
-
197
-
198
-
199
-
200
-
201
-
202
-
203
-
204
-
205
-
206
-
207
-
208
-
209
-
210
-
211
-
212
-
213
-
214
-
215
-
216
-
217
-
218
-
219
-
220
-
221
-
222
-
223
-
224
-
225
-
226
-
227
-
228
-
229
-
230
-
231
-
232
 |
 |
derivative contracts. As a result, there can be no assurance that hedging activities using derivatives will
effectively manage our interest rate sensitivity, have the desired beneficial impact on our results of operations or
financial condition or not adversely impact our liquidity and earnings.
Our use of derivatives also exposes us to market risk and credit risk. Market risk is the chance of financial
loss resulting from changes in interest rates, foreign exchange rates and market liquidity. Our Floor Income
Contracts and some of the basis swaps we use to manage earnings variability caused by having different reset
characteristics on interest-earning assets and interest-bearing liabilities do not qualify for hedge accounting
treatment. Therefore, the change in fair value, called the “mark-to-market,” of these derivative instruments is
included in our statement of income. A decline in the fair value of these derivatives could have a material adverse
effect on our reported earnings.
Credit risk is the risk that a counterparty will not perform its obligations under a contract. Credit risk is
limited to the loss of the fair value gain in a derivative that the counterparty or clearinghouse owes us and
therefore exists for derivatives with a positive fair value. At December 31, 2013, we had a net positive exposure
(derivative gain positions less collateral posted by counterparties) related to derivatives of $83 million, excluding
securitization trusts discussed below. If a counterparty or clearinghouse fails to perform its obligations, we could,
depending on the type of counterparty arrangement, experience a loss of liquidity or an economic loss. In
addition, we might not be able to cost effectively replace the derivative position depending on the type of
derivative and the current economic environment.
Our securitization trusts, which we are required to consolidate on our balance sheet, have $10.7 billion of
Euro and British Pound Sterling denominated bonds outstanding as of December 31, 2013. To convert these non-
U.S. dollar denominated bonds into U.S. dollar liabilities, the trusts have entered into foreign-currency swaps
with highly rated counterparties. In addition, the trusts have entered into $12.8 billion of interest rate swaps,
which are primarily used to convert Prime rate payments received on securitized loans to LIBOR paid on the
bonds. At December 31, 2013, the net positive exposure on swaps in securitization trusts was $968 million. A
failure by a swap counterparty to perform its obligations could, if the swap has a positive fair value to us,
materially and adversely affect our earnings.
High or increasing interest rate environments may cause our Floor Income to decline, which may adversely
affect our earnings.
FFELP Loans disbursed before April 1, 2006, generally earn interest at the higher of either the borrower
rate, which is fixed over a period of time, or a floating rate based on a Special Allowance Payment (“SAP”)
formula set by ED. We have generally financed our FFELP Loans with floating rate debt whose interest is
matched closely to the floating nature of the applicable SAP formula. If a decline in interest rates causes the
borrower rate to exceed the SAP formula rate, we will continue to earn interest on the loan at the fixed borrower
rate while the floating rate interest on our debt will continue to decline. The additional spread earned between the
fixed borrower rate and the SAP formula rate is referred to as “Floor Income.”
Depending on the type of FFELP Loan and when it was originated, the borrower rate is either fixed to term
or is reset to a market rate each July 1. For loans where the borrower rate is fixed to term, we may earn Floor
Income for an extended period of time; for those loans where the borrower interest rate is reset annually on
July 1, we may earn Floor Income to the next reset date. In accordance with legislation enacted in 2006, holders
of FFELP Loans are required to rebate Floor Income to ED for all FFELP Loans disbursed on or after April 1,
2006. After accounting for these required rebates, as of December 31, 2013, approximately $56.8 billion of our
FFELP Loan portfolio was eligible to earn Floor Income.
Floor Income can be volatile as rates on the underlying student loans move up and down. We generally
hedge this risk by selling Floor Income Contracts to counterparties which lock in the value of the Floor Income
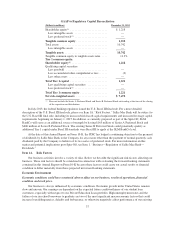
over the term of the contract. As of December 31, 2013, approximately $31.7 billion (56 percent) of our FFELP
Loans eligible to earn Floor Income were economically hedged with Floor Income Contracts. A rise in interest
rates will reduce the amount of Floor Income received on the approximately $25.1 billion of FFELP Loans not
hedged with Floor Income Contracts, which will compress our interest margins and depress its earnings.
41