Sallie Mae 2013 Annual Report Download - page 126
Download and view the complete annual report
Please find page 126 of the 2013 Sallie Mae annual report below. You can navigate through the pages in the report by either clicking on the pages listed below, or by using the keyword search tool below to find specific information within the annual report.-
 1
1 -
2
-
3
-
4
-
5
-
6
-
7
-
8
-
9
-
10
-
11
-
12
-
13
-
14
-
15
-
16
-
17
-
18
-
19
-
20
-
21
-
22
-
23
-
24
-
25
-
26
-
27
-
28
-
29
-
30
-
31
-
32
-
33
-
34
-
35
-
36
-
37
-
38
-
39
-
40
-
41
-
42
-
43
-
44
-
45
-
46
-
47
-
48
-
49
-
50
-
51
-
52
-
53
-
54
-
55
-
56
-
57
-
58
-
59
-
60
-
61
-
62
-
63
-
64
-
65
-
66
-
67
-
68
-
69
-
70
-
71
-
72
-
73
-
74
-
75
-
76
-
77
-
78
-
79
-
80
-
81
-
82
-
83
-
84
-
85
-
86
-
87
-
88
-
89
-
90
-
91
-
92
-
93
-
94
-
95
-
96
-
97
-
98
-
99
-
100
-
101
-
102
-
103
-
104
-
105
-
106
-
107
-
108
-
109
-
110
-
111
-
112
-
113
-
114
-
115
-
 116
116 -
 117
117 -
 118
118 -
 119
119 -
 120
120 -
 121
121 -
 122
122 -
 123
123 -
 124
124 -
 125
125 -
 126
126 -
 127
127 -
 128
128 -
 129
129 -
 130
130 -
 131
131 -
 132
132 -
 133
133 -
 134
134 -
 135
135 -
 136
136 -
137
-
138
-
139
-
140
-
141
-
142
-
143
-
144
-
145
-
146
-
147
-
148
-
149
-
150
-
151
-
152
-
153
-
154
-
155
-
156
-
157
-
158
-
159
-
160
-
161
-
162
-
163
-
164
-
165
-
166
-
167
-
168
-
169
-
170
-
171
-
172
-
173
-
174
-
175
-
176
-
177
-
178
-
179
-
180
-
181
-
182
-
183
-
184
-
185
-
186
-
187
-
188
-
189
-
190
-
191
-
192
-
193
-
194
-
195
-
196
-
197
-
198
-
199
-
200
-
201
-
202
-
203
-
204
-
205
-
206
-
207
-
208
-
209
-
210
-
211
-
212
-
213
-
214
-
215
-
216
-
217
-
218
-
219
-
220
-
221
-
222
-
223
-
224
-
225
-
226
-
227
-
228
-
229
-
230
-
231
-
232
 |
 |

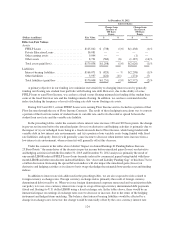
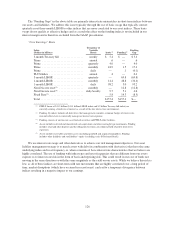
At December 31, 2012
Fair Value
Interest Rates:
Change from
Increase of
100 Basis
Points
Change from
Increase of
300 Basis
Points
(Dollars in millions) $ % $ %
Effect on Fair Values
Assets
FFELP Loans ............................ $125,042 $ (738) (1)% $(1,438) (1)%
Private Education Loans .................... 36,081 — — — —
Other earning assets ....................... 9,994 — — (1) —
Other assets ............................. 8,721 (560) (6) (1,187) (14)%
Total assets gain/(loss) ..................... $179,838 $(1,298) (1)% $(2,626) (1)%
Liabilities
Interest-bearing liabilities ................... $166,071 $ (829) — % $(2,298) (1)%
Other liabilities ........................... 3,937 (422) (11) (274) (7)
Total liabilities (gain)/loss .................. $170,008 $(1,251) (1)% $(2,572) (2)%
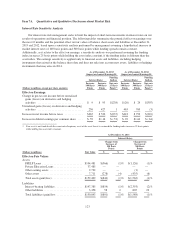
A primary objective in our funding is to minimize our sensitivity to changing interest rates by generally
funding our floating rate student loan portfolio with floating rate debt. However, due to the ability of some
FFELP loans to earn Floor Income, we can have a fixed versus floating mismatch in funding if the student loan
earns at the fixed borrower rate and the funding remains floating. In addition, we can have a mismatch in the
index (including the frequency of reset) of floating rate debt versus floating rate assets.
During 2013 and 2012, certain FFELP Loans were earning Floor Income and we locked in a portion of that
Floor Income through the use of Floor Income Contracts. The result of these hedging transactions was to convert
a portion of the fixed rate nature of student loans to variable rate, and to fix the relative spread between the
student loan asset rate and the variable rate liability.
In the preceding tables, under the scenario where interest rates increase 100 and 300 basis points, the change
in pre-tax net income before the unrealized gains (losses) on derivative and hedging activities is primarily due to
the impact of (i) our unhedged loans being in a fixed-rate mode due to Floor Income, while being funded with
variable debt in low interest rate environments; and (ii) a portion of our variable assets being funded with fixed
rate liabilities and equity. Item (i) will generally cause income to decrease when interest rates increase from a
low interest rate environment, whereas item (ii) will generally offset this decrease.
Under the scenario in the tables above labeled “Impact on Annual Earnings If: Funding Indices Increase
25 Basis Points,” the main driver of the decrease in pre-tax income before unrealized gains (losses) on derivative
and hedging activities in both the December 31, 2013 and December 31, 2012 analyses is primarily the result of
one-month LIBOR-indexed FFELP Loans (loans formerly indexed to commercial paper) being funded with three-
month LIBOR and other non-discrete indexed liabilities. See “Asset and Liability Funding Gap” of this Item 7A for
a further discussion. Increasing the spread between indices will also impact the unrealized gains (losses) on
derivative and hedging activities as it relates to basis swaps that hedge the mismatch between the asset and funding
indices.
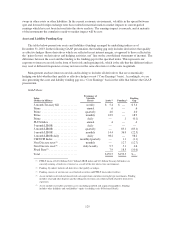
In addition to interest rate risk addressed in the preceding tables, we are also exposed to risks related to
foreign currency exchange rates. Foreign currency exchange risk is primarily the result of foreign currency
denominated debt issued by us. When we issue foreign denominated corporate unsecured and securitization debt,
our policy is to use cross currency interest rate swaps to swap all foreign currency denominated debt payments
(fixed and floating) to U.S. dollar LIBOR using a fixed exchange rate. In the tables above, there would be an
immaterial impact on earnings if exchange rates were to decrease or increase, due to the terms of the hedging
instrument and hedged items matching. The balance sheet interest bearing liabilities would be affected by a
change in exchange rates; however, the change would be materially offset by the cross currency interest rate
124