Sallie Mae 2013 Annual Report Download - page 35
Download and view the complete annual report
Please find page 35 of the 2013 Sallie Mae annual report below. You can navigate through the pages in the report by either clicking on the pages listed below, or by using the keyword search tool below to find specific information within the annual report.-
 1
1 -
2
-
3
-
4
-
5
-
6
-
7
-
8
-
9
-
10
-
11
-
12
-
13
-
14
-
15
-
16
-
17
-
18
-
19
-
20
-
21
-
22
-
23
-
24
-
 25
25 -
 26
26 -
 27
27 -
 28
28 -
 29
29 -
 30
30 -
 31
31 -
 32
32 -
 33
33 -
 34
34 -
 35
35 -
 36
36 -
 37
37 -
 38
38 -
 39
39 -
 40
40 -
 41
41 -
 42
42 -
 43
43 -
 44
44 -
 45
45 -
46
-
47
-
48
-
49
-
50
-
51
-
52
-
53
-
54
-
55
-
56
-
57
-
58
-
59
-
60
-
61
-
62
-
63
-
64
-
65
-
66
-
67
-
68
-
69
-
70
-
71
-
72
-
73
-
74
-
75
-
76
-
77
-
78
-
79
-
80
-
81
-
82
-
83
-
84
-
85
-
86
-
87
-
88
-
89
-
90
-
91
-
92
-
93
-
94
-
95
-
96
-
97
-
98
-
99
-
100
-
101
-
102
-
103
-
104
-
105
-
106
-
107
-
108
-
109
-
110
-
111
-
112
-
113
-
114
-
115
-
116
-
117
-
118
-
119
-
120
-
121
-
122
-
123
-
124
-
125
-
126
-
127
-
128
-
129
-
130
-
131
-
132
-
133
-
134
-
135
-
136
-
137
-
138
-
139
-
140
-
141
-
142
-
143
-
144
-
145
-
146
-
147
-
148
-
149
-
150
-
151
-
152
-
153
-
154
-
155
-
156
-
157
-
158
-
159
-
160
-
161
-
162
-
163
-
164
-
165
-
166
-
167
-
168
-
169
-
170
-
171
-
172
-
173
-
174
-
175
-
176
-
177
-
178
-
179
-
180
-
181
-
182
-
183
-
184
-
185
-
186
-
187
-
188
-
189
-
190
-
191
-
192
-
193
-
194
-
195
-
196
-
197
-
198
-
199
-
200
-
201
-
202
-
203
-
204
-
205
-
206
-
207
-
208
-
209
-
210
-
211
-
212
-
213
-
214
-
215
-
216
-
217
-
218
-
219
-
220
-
221
-
222
-
223
-
224
-
225
-
226
-
227
-
228
-
229
-
230
-
231
-
232
 |
 |

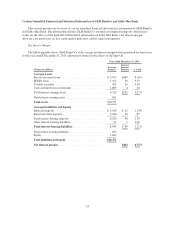
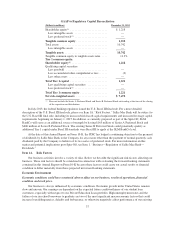
Certain Unaudited Financial and Statistical Information of SLM BankCo and Sallie Mae Bank
This section provides an overview of certain unaudited financial and statistical information of SLM BankCo
and Sallie Mae Bank. The information includes SLM BankCo’s net interest margin and deposits adjusted pro
forma for the effects of the Spin-Off and historical information on Sallie Mae Bank’s net interest margin,
allowance for loan losses, its key credit quality indicators, and its capital information.
Net Interest Margin
The following table shows SLM BankCo’s daily average net interest margin before provision for loan losses
for the year ended December 31, 2013 adjusted pro forma for the effects of the Spin-Off.
Year ended December 31, 2013
(Dollars in millions)
Average
Balance
Interest
Income/
Expense % Yield
Average Assets
Private education loans ............................. $ 5,997 $489 8.16%
FFELP loans ..................................... 1,141 38 3.33
Taxable securities ................................. 493 20 3.98
Cash and short term investments ...................... 2,089 4 .20
Total interest-earning assets ......................... 9,720 $551 5.67%
Non-interest-earning assets .......................... 651
Total assets ...................................... $10,371
Average Liabilities and Equity
Brokered deposits ................................. $ 5,010 $ 62 1.24%
Retail and other deposits ............................ 3,010 26 .87
Total interest-bearing deposits ....................... 8,020 88 1.10
Other interest-bearing liabilities ...................... 21 1 3.06
Total interest-bearing liabilities ..................... 8,041 $ 89 1.11%
Non-interest-bearing liabilities ....................... 689
Equity ........................................... 1,641
Total liabilities and equity ......................... $10,371
Net interest margin ............................... $462 4.75%
33