Sallie Mae 2013 Annual Report Download - page 100
Download and view the complete annual report
Please find page 100 of the 2013 Sallie Mae annual report below. You can navigate through the pages in the report by either clicking on the pages listed below, or by using the keyword search tool below to find specific information within the annual report.-
 1
1 -
2
-
3
-
4
-
5
-
6
-
7
-
8
-
9
-
10
-
11
-
12
-
13
-
14
-
15
-
16
-
17
-
18
-
19
-
20
-
21
-
22
-
23
-
24
-
25
-
26
-
27
-
28
-
29
-
30
-
31
-
32
-
33
-
34
-
35
-
36
-
37
-
38
-
39
-
40
-
41
-
42
-
43
-
44
-
45
-
46
-
47
-
48
-
49
-
50
-
51
-
52
-
53
-
54
-
55
-
56
-
57
-
58
-
59
-
60
-
61
-
62
-
63
-
64
-
65
-
66
-
67
-
68
-
69
-
70
-
71
-
72
-
73
-
74
-
75
-
76
-
77
-
78
-
79
-
80
-
81
-
82
-
83
-
84
-
85
-
86
-
87
-
88
-
89
-
 90
90 -
 91
91 -
 92
92 -
 93
93 -
 94
94 -
 95
95 -
 96
96 -
 97
97 -
 98
98 -
 99
99 -
 100
100 -
 101
101 -
 102
102 -
 103
103 -
 104
104 -
 105
105 -
 106
106 -
 107
107 -
 108
108 -
 109
109 -
 110
110 -
111
-
112
-
113
-
114
-
115
-
116
-
117
-
118
-
119
-
120
-
121
-
122
-
123
-
124
-
125
-
126
-
127
-
128
-
129
-
130
-
131
-
132
-
133
-
134
-
135
-
136
-
137
-
138
-
139
-
140
-
141
-
142
-
143
-
144
-
145
-
146
-
147
-
148
-
149
-
150
-
151
-
152
-
153
-
154
-
155
-
156
-
157
-
158
-
159
-
160
-
161
-
162
-
163
-
164
-
165
-
166
-
167
-
168
-
169
-
170
-
171
-
172
-
173
-
174
-
175
-
176
-
177
-
178
-
179
-
180
-
181
-
182
-
183
-
184
-
185
-
186
-
187
-
188
-
189
-
190
-
191
-
192
-
193
-
194
-
195
-
196
-
197
-
198
-
199
-
200
-
201
-
202
-
203
-
204
-
205
-
206
-
207
-
208
-
209
-
210
-
211
-
212
-
213
-
214
-
215
-
216
-
217
-
218
-
219
-
220
-
221
-
222
-
223
-
224
-
225
-
226
-
227
-
228
-
229
-
230
-
231
-
232
 |
 |
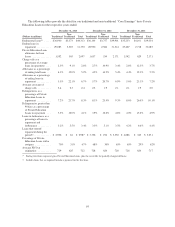
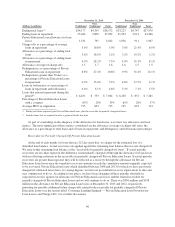
compared with 3.5 percent in 2012. As of December 31, 2013, 1 percent of loans in current status were
delinquent as of the end of the prior month, but were granted a forbearance that made them current as of
December 31, 2013 (customers made payments on approximately 28 percent of these loans as a prerequisite to
being granted forbearance).
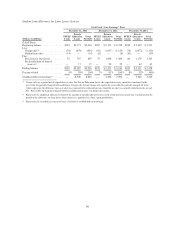
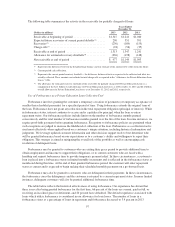
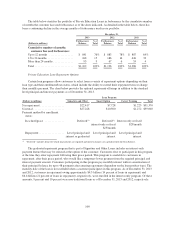
Tracking by First Time in Forbearance Compared to All Loans Entering Repayment —
Portfolio data through December 31, 2013
Status distribution
36 months after
being granted
forbearance
for the first time
Status distribution
36 months after
entering repayment
(all loans)
Status distribution
36 months after
entering repayment for
loans never entering
forbearance
In-school/grace/deferment .......... 9.7% 9.1% 5.6%
Current ......................... 51.2 59.8 67.6
Delinquent 31-60 days ............. 3.1 2.0 .4
Delinquent 61-90 days ............. 1.9 1.1 .1
Delinquent greater than 90 days ..... 4.7 2.7 .3
Forbearance ..................... 3.9 3.0 —
Defaulted ....................... 20.1 11.4 7.5
Paid ........................... 5.4 10.9 18.5
Total ........................... 100% 100% 100%
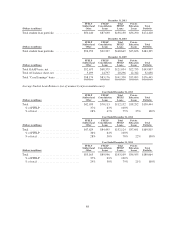
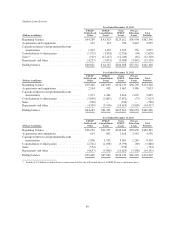
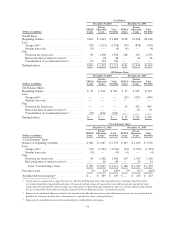
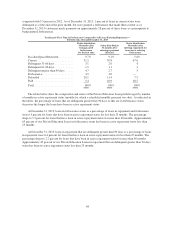
The tables below show the composition and status of the Private Education Loan portfolio aged by number
of months in active repayment status (months for which a scheduled monthly payment was due). As indicated in
the tables, the percentage of loans that are delinquent greater than 90 days or that are in forbearance status
decreases the longer the loans have been in active repayment status.
At December 31, 2013, loans in forbearance status as a percentage of loans in repayment and forbearance
were 6.5 percent for loans that have been in active repayment status for less than 25 months. The percentage
drops to 1.2 percent for loans that have been in active repayment status for more than 48 months. Approximately
63 percent of our Private Education Loans in forbearance status has been in active repayment status less than
25 months.
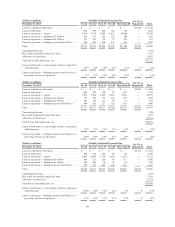
At December 31, 2013, loans in repayment that are delinquent greater than 90 days as a percentage of loans
in repayment were 6.4 percent for loans that have been in active repayment status for less than 25 months. The
percentage drops to 2.2 percent for loans that have been in active repayment status for more than 48 months.
Approximately 49 percent of our Private Education Loans in repayment that are delinquent greater than 90 days
status has been in active repayment status less than 25 months.
98