Sallie Mae 2013 Annual Report Download - page 111
Download and view the complete annual report
Please find page 111 of the 2013 Sallie Mae annual report below. You can navigate through the pages in the report by either clicking on the pages listed below, or by using the keyword search tool below to find specific information within the annual report.-
 1
1 -
2
-
3
-
4
-
5
-
6
-
7
-
8
-
9
-
10
-
11
-
12
-
13
-
14
-
15
-
16
-
17
-
18
-
19
-
20
-
21
-
22
-
23
-
24
-
25
-
26
-
27
-
28
-
29
-
30
-
31
-
32
-
33
-
34
-
35
-
36
-
37
-
38
-
39
-
40
-
41
-
42
-
43
-
44
-
45
-
46
-
47
-
48
-
49
-
50
-
51
-
52
-
53
-
54
-
55
-
56
-
57
-
58
-
59
-
60
-
61
-
62
-
63
-
64
-
65
-
66
-
67
-
68
-
69
-
70
-
71
-
72
-
73
-
74
-
75
-
76
-
77
-
78
-
79
-
80
-
81
-
82
-
83
-
84
-
85
-
86
-
87
-
88
-
89
-
90
-
91
-
92
-
93
-
94
-
95
-
96
-
97
-
98
-
99
-
100
-
 101
101 -
 102
102 -
 103
103 -
 104
104 -
 105
105 -
 106
106 -
 107
107 -
 108
108 -
 109
109 -
 110
110 -
 111
111 -
 112
112 -
 113
113 -
 114
114 -
 115
115 -
 116
116 -
 117
117 -
 118
118 -
 119
119 -
 120
120 -
 121
121 -
122
-
123
-
124
-
125
-
126
-
127
-
128
-
129
-
130
-
131
-
132
-
133
-
134
-
135
-
136
-
137
-
138
-
139
-
140
-
141
-
142
-
143
-
144
-
145
-
146
-
147
-
148
-
149
-
150
-
151
-
152
-
153
-
154
-
155
-
156
-
157
-
158
-
159
-
160
-
161
-
162
-
163
-
164
-
165
-
166
-
167
-
168
-
169
-
170
-
171
-
172
-
173
-
174
-
175
-
176
-
177
-
178
-
179
-
180
-
181
-
182
-
183
-
184
-
185
-
186
-
187
-
188
-
189
-
190
-
191
-
192
-
193
-
194
-
195
-
196
-
197
-
198
-
199
-
200
-
201
-
202
-
203
-
204
-
205
-
206
-
207
-
208
-
209
-
210
-
211
-
212
-
213
-
214
-
215
-
216
-
217
-
218
-
219
-
220
-
221
-
222
-
223
-
224
-
225
-
226
-
227
-
228
-
229
-
230
-
231
-
232
 |
 |

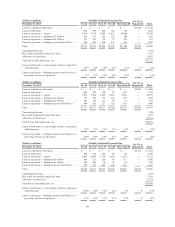
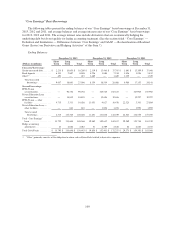
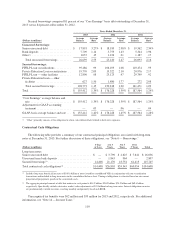
“Core Earnings” Basis Borrowings
The following tables present the ending balances of our “Core Earnings” basis borrowings at December 31,
2013, 2012 and 2011, and average balances and average interest rates of our “Core Earnings” basis borrowings
for 2013, 2012 and 2011. The average interest rates include derivatives that are economically hedging the
underlying debt but do not qualify for hedge accounting treatment. (See the section titled “‘Core Earnings’ —
Definition and Limitations — Differences between ‘Core Earnings’ and GAAP — Reclassification of Realized
Gains (Losses) on Derivative and Hedging Activities” of this Item 7).
Ending Balances
December 31, 2013 December 31, 2012 December 31, 2011
(Dollars in millions)
Short
Term
Long
Term Total
Short
Term
Long
Term Total
Short
Term
Long
Term Total
Unsecured borrowings:
Senior unsecured debt ....... $ 2,213 $ 16,056 $ 18,269 $ 2,319 $ 15,446 $ 17,765 $ 1,801 $ 15,199 $ 17,000
Bank deposits ............. 6,133 2,807 8,940 4,226 3,088 7,314 3,856 1,956 5,812
Other(1) .................. 691 — 691 1,609 — 1,609 1,329 — 1,329
Total unsecured
borrowings ........... 9,037 18,863 27,900 8,154 18,534 26,688 6,986 17,155 24,141
Secured borrowings:
FFELP Loan
securitizations ........... — 90,756 90,756 — 105,525 105,525 — 107,905 107,905
Private Education Loan
securitizations ........... — 18,835 18,835 — 19,656 19,656 — 19,297 19,297
FFELP Loan — other
facilities ............... 4,715 5,311 10,026 11,651 4,827 16,478 22,523 5,361 27,884
Private Education Loan —
other facilities ........... — 843 843 — 1,070 1,070 — 1,992 1,992
Total secured
borrowings ........... 4,715 115,745 120,460 11,651 131,078 142,729 22,523 134,555 157,078
Total “Core Earnings”
basis .................. 13,752 134,608 148,360 19,805 149,612 169,417 29,509 151,710 181,219
Hedge accounting
adjustments ............. 43 2,040 2,083 51 2,789 2,840 64 2,683 2,747
Total GAAP basis .......... $ 13,795 $ 136,648 $ 150,443 $ 19,856 $ 152,401 $ 172,257 $ 29,573 $ 154,393 $ 183,966
(1) “Other” primarily consists of the obligation to return cash collateral held related to derivative exposure.
109