Sallie Mae 2013 Annual Report Download - page 189
Download and view the complete annual report
Please find page 189 of the 2013 Sallie Mae annual report below. You can navigate through the pages in the report by either clicking on the pages listed below, or by using the keyword search tool below to find specific information within the annual report.-
 1
1 -
2
-
3
-
4
-
5
-
6
-
7
-
8
-
9
-
10
-
11
-
12
-
13
-
14
-
15
-
16
-
17
-
18
-
19
-
20
-
21
-
22
-
23
-
24
-
25
-
26
-
27
-
28
-
29
-
30
-
31
-
32
-
33
-
34
-
35
-
36
-
37
-
38
-
39
-
40
-
41
-
42
-
43
-
44
-
45
-
46
-
47
-
48
-
49
-
50
-
51
-
52
-
53
-
54
-
55
-
56
-
57
-
58
-
59
-
60
-
61
-
62
-
63
-
64
-
65
-
66
-
67
-
68
-
69
-
70
-
71
-
72
-
73
-
74
-
75
-
76
-
77
-
78
-
79
-
80
-
81
-
82
-
83
-
84
-
85
-
86
-
87
-
88
-
89
-
90
-
91
-
92
-
93
-
94
-
95
-
96
-
97
-
98
-
99
-
100
-
101
-
102
-
103
-
104
-
105
-
106
-
107
-
108
-
109
-
110
-
111
-
112
-
113
-
114
-
115
-
116
-
117
-
118
-
119
-
120
-
121
-
122
-
123
-
124
-
125
-
126
-
127
-
128
-
129
-
130
-
131
-
132
-
133
-
134
-
135
-
136
-
137
-
138
-
139
-
140
-
141
-
142
-
143
-
144
-
145
-
146
-
147
-
148
-
149
-
150
-
151
-
152
-
153
-
154
-
155
-
156
-
157
-
158
-
159
-
160
-
161
-
162
-
163
-
164
-
165
-
166
-
167
-
168
-
169
-
170
-
171
-
172
-
173
-
174
-
175
-
176
-
177
-
178
-
 179
179 -
 180
180 -
 181
181 -
 182
182 -
 183
183 -
 184
184 -
 185
185 -
 186
186 -
 187
187 -
 188
188 -
 189
189 -
 190
190 -
 191
191 -
 192
192 -
 193
193 -
 194
194 -
 195
195 -
 196
196 -
 197
197 -
 198
198 -
 199
199 -
200
-
201
-
202
-
203
-
204
-
205
-
206
-
207
-
208
-
209
-
210
-
211
-
212
-
213
-
214
-
215
-
216
-
217
-
218
-
219
-
220
-
221
-
222
-
223
-
224
-
225
-
226
-
227
-
228
-
229
-
230
-
231
-
232
 |
 |

SLM CORPORATION
NOTES TO CONSOLIDATED FINANCIAL STATEMENTS (Continued)
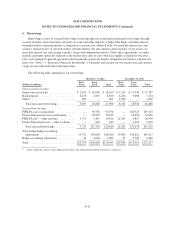
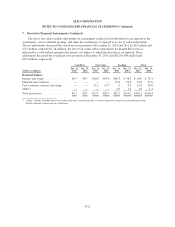
7. Derivative Financial Instruments (Continued)
Summary of Derivative Financial Statement Impact
The following tables summarize the fair values and notional amounts or number of contracts of all
derivative instruments at December 31, 2013 and 2012, and their impact on other comprehensive income and
earnings for 2013, 2012 and 2011.
Impact of Derivatives on Consolidated Balance Sheet
Cash Flow Fair Value Trading Total
(Dollars in millions)
Hedged Risk
Exposure
Dec. 31,
2013
Dec. 31,
2012
Dec. 31,
2013
Dec. 31,
2012
Dec. 31,
2013
Dec. 31,
2012
Dec. 31,
2013
Dec. 31,
2012
Fair Values(1)
Derivative Assets:
Interest rate swaps .... Interest rate $24 $ — $ 738 $1,396 $ 61 $ 150 $ 823 $ 1,546
Cross-currency interest
rate swaps ........
Foreign currency and
interest rate — — 1,185 1,165 — 70 1,185 1,235
Other(2) ............. Interest rate — — — —2424
Total derivative
assets(3) ........... 24 — 1,923 2,561 63 224 2,010 2,785
Derivative Liabilities:
Interest rate swaps .... Interest rate — (11) (149) (1) (215) (197) (364) (209)
Floor Income
Contracts ......... Interest rate — — — — (1,384) (2,154) (1,384) (2,154)
Cross-currency interest
rate swaps ........
Foreign currency and
interestrate — — (155) (136) (31) — (186) (136)
Other(2) ............. Interest rate — — — — (23) — (23) —
Total derivative
liabilities(3) ........ — (11) (304) (137) (1,653) (2,351) (1,957) (2,499)
Net total derivatives . . $24 $(11) $1,619 $2,424 $(1,590) $(2,127) $ 53 $ 286
(1) Fair values reported are exclusive of collateral held and pledged and accrued interest. Assets and liabilities are presented without
consideration of master netting agreements. Derivatives are carried on the balance sheet based on net position by counterparty under
master netting agreements, and classified in other assets or other liabilities depending on whether in a net positive or negative position.
(2) “Other” includes embedded derivatives bifurcated from securitization debt as well as derivatives related to our Total Return Swap Facility
and back-to-back private credit floors.
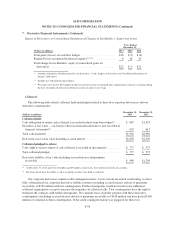
(3) The following table reconciles gross positions with the impact of master netting agreements to the balance sheet classification:
Other Assets Other Liabilities
(Dollar in millions)
December 31,
2013
December 31,
2012
December 31,
2013
December 31,
2012
Gross position .................................. $2,010 $ 2,785 $(1,957) $(2,499)
Impact of master netting agreements ................ (386) (544) 386 544
Derivative values with impact of master netting
agreements (as carried on balance sheet) ........... 1,624 2,241 (1,571) (1,955)
Cash collateral (held) pledged ..................... (687) (1,423) 777 973
Net position .................................... $ 937 $ 818 $ (794) $ (982)
F-51