Sallie Mae 2013 Annual Report Download - page 173
Download and view the complete annual report
Please find page 173 of the 2013 Sallie Mae annual report below. You can navigate through the pages in the report by either clicking on the pages listed below, or by using the keyword search tool below to find specific information within the annual report.-
 1
1 -
2
-
3
-
4
-
5
-
6
-
7
-
8
-
9
-
10
-
11
-
12
-
13
-
14
-
15
-
16
-
17
-
18
-
19
-
20
-
21
-
22
-
23
-
24
-
25
-
26
-
27
-
28
-
29
-
30
-
31
-
32
-
33
-
34
-
35
-
36
-
37
-
38
-
39
-
40
-
41
-
42
-
43
-
44
-
45
-
46
-
47
-
48
-
49
-
50
-
51
-
52
-
53
-
54
-
55
-
56
-
57
-
58
-
59
-
60
-
61
-
62
-
63
-
64
-
65
-
66
-
67
-
68
-
69
-
70
-
71
-
72
-
73
-
74
-
75
-
76
-
77
-
78
-
79
-
80
-
81
-
82
-
83
-
84
-
85
-
86
-
87
-
88
-
89
-
90
-
91
-
92
-
93
-
94
-
95
-
96
-
97
-
98
-
99
-
100
-
101
-
102
-
103
-
104
-
105
-
106
-
107
-
108
-
109
-
110
-
111
-
112
-
113
-
114
-
115
-
116
-
117
-
118
-
119
-
120
-
121
-
122
-
123
-
124
-
125
-
126
-
127
-
128
-
129
-
130
-
131
-
132
-
133
-
134
-
135
-
136
-
137
-
138
-
139
-
140
-
141
-
142
-
143
-
144
-
145
-
146
-
147
-
148
-
149
-
150
-
151
-
152
-
153
-
154
-
155
-
156
-
157
-
158
-
159
-
160
-
161
-
162
-
 163
163 -
 164
164 -
 165
165 -
 166
166 -
 167
167 -
 168
168 -
 169
169 -
 170
170 -
 171
171 -
 172
172 -
 173
173 -
 174
174 -
 175
175 -
 176
176 -
 177
177 -
 178
178 -
 179
179 -
 180
180 -
 181
181 -
 182
182 -
 183
183 -
184
-
185
-
186
-
187
-
188
-
189
-
190
-
191
-
192
-
193
-
194
-
195
-
196
-
197
-
198
-
199
-
200
-
201
-
202
-
203
-
204
-
205
-
206
-
207
-
208
-
209
-
210
-
211
-
212
-
213
-
214
-
215
-
216
-
217
-
218
-
219
-
220
-
221
-
222
-
223
-
224
-
225
-
226
-
227
-
228
-
229
-
230
-
231
-
232
 |
 |

SLM CORPORATION
NOTES TO CONSOLIDATED FINANCIAL STATEMENTS (Continued)
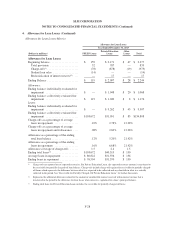
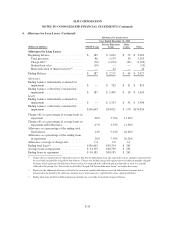
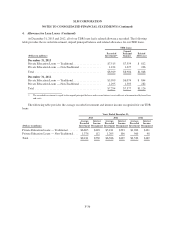
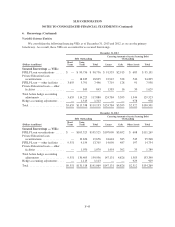
4. Allowance for Loan Losses (Continued)
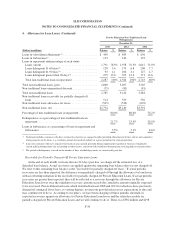
million in the allowance for Private Education Loan losses at December 31, 2013 and 2012, respectively,
providing for possible additional future charge-offs related to the receivable for partially charged-off Private
Education Loans.
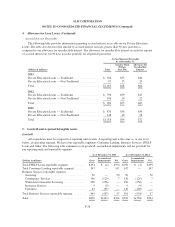
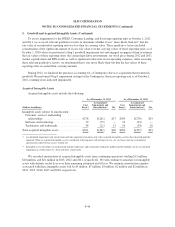
The following table summarizes the activity in the receivable for partially charged-off loans.
Years Ended December 31,
(Dollars in millions) 2013 2012 2011
Receivable at beginning of period .............................. $1,347 $1,241 $1,040
Expected future recoveries of current period defaults(1) ............. 290 351 391
Recoveries(2) ............................................... (230) (189) (155)
Charge-offs(3) .............................................. (94) (56) (35)
Receivable at end of period ................................... 1,313 1,347 1,241
Allowance for estimated recovery shortfalls(4) ..................... (336) (198) (148)
Net receivable at end of period ................................ $ 977 $1,149 $1,093
(1) Represents the difference between the loan balance and our estimate of the amount to be collected in the future.
(2) Current period cash collections.
(3) Represents the current period recovery shortfall – the difference between what was expected to be collected and what was actually
collected. These amounts are included in the Private Education Loan total charge-offs as reported in the “Allowance for Loan
Losses Metrics” tables.
(4) The allowance for estimated recovery shortfalls of the receivable for partially charged-off Private Education Loans is a component
of the $2.1 billion, $2.2 billion and $2.2 billion overall allowance for Private Education Loan losses as of December 31, 2013,
2012 and 2011, respectively.
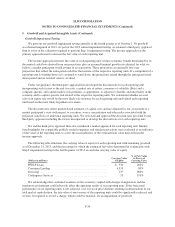
Troubled Debt Restructurings (“TDRs”)
We modify the terms of loans for certain customers when we believe such modifications may increase the
ability and willingness of a customer to make payments and thus increase the ultimate overall amount collected
on a loan. These modifications generally take the form of a forbearance, a temporary interest rate reduction or an
extended repayment plan. For customers experiencing financial difficulty, certain Private Education Loans for
which we have granted either a forbearance of greater than three months, an interest rate reduction or an extended
repayment plan are classified as TDRs. Approximately 45 percent and 43 percent of the loans granted
forbearance have qualified as a TDR loan at December 31, 2013, and 2012, respectively. The unpaid principal
balance of TDR loans that were in an interest rate reduction plan as of December 31, 2013 and 2012 was
$1.5 billion and $1.0 billion, respectively.
F-35