Sallie Mae 2013 Annual Report Download - page 205
Download and view the complete annual report
Please find page 205 of the 2013 Sallie Mae annual report below. You can navigate through the pages in the report by either clicking on the pages listed below, or by using the keyword search tool below to find specific information within the annual report.-
 1
1 -
2
-
3
-
4
-
5
-
6
-
7
-
8
-
9
-
10
-
11
-
12
-
13
-
14
-
15
-
16
-
17
-
18
-
19
-
20
-
21
-
22
-
23
-
24
-
25
-
26
-
27
-
28
-
29
-
30
-
31
-
32
-
33
-
34
-
35
-
36
-
37
-
38
-
39
-
40
-
41
-
42
-
43
-
44
-
45
-
46
-
47
-
48
-
49
-
50
-
51
-
52
-
53
-
54
-
55
-
56
-
57
-
58
-
59
-
60
-
61
-
62
-
63
-
64
-
65
-
66
-
67
-
68
-
69
-
70
-
71
-
72
-
73
-
74
-
75
-
76
-
77
-
78
-
79
-
80
-
81
-
82
-
83
-
84
-
85
-
86
-
87
-
88
-
89
-
90
-
91
-
92
-
93
-
94
-
95
-
96
-
97
-
98
-
99
-
100
-
101
-
102
-
103
-
104
-
105
-
106
-
107
-
108
-
109
-
110
-
111
-
112
-
113
-
114
-
115
-
116
-
117
-
118
-
119
-
120
-
121
-
122
-
123
-
124
-
125
-
126
-
127
-
128
-
129
-
130
-
131
-
132
-
133
-
134
-
135
-
136
-
137
-
138
-
139
-
140
-
141
-
142
-
143
-
144
-
145
-
146
-
147
-
148
-
149
-
150
-
151
-
152
-
153
-
154
-
155
-
156
-
157
-
158
-
159
-
160
-
161
-
162
-
163
-
164
-
165
-
166
-
167
-
168
-
169
-
170
-
171
-
172
-
173
-
174
-
175
-
176
-
177
-
178
-
179
-
180
-
181
-
182
-
183
-
184
-
185
-
186
-
187
-
188
-
189
-
190
-
191
-
192
-
193
-
194
-
 195
195 -
 196
196 -
 197
197 -
 198
198 -
 199
199 -
 200
200 -
 201
201 -
 202
202 -
 203
203 -
 204
204 -
 205
205 -
 206
206 -
 207
207 -
 208
208 -
 209
209 -
 210
210 -
 211
211 -
 212
212 -
 213
213 -
 214
214 -
 215
215 -
216
-
217
-
218
-
219
-
220
-
221
-
222
-
223
-
224
-
225
-
226
-
227
-
228
-
229
-
230
-
231
-
232
 |
 |

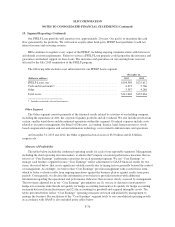
SLM CORPORATION
NOTES TO CONSOLIDATED FINANCIAL STATEMENTS (Continued)
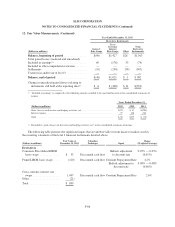
12. Fair Value Measurements (Continued)
The significant inputs that are unobservable or from inactive markets related to our level 3 derivatives
detailed in the table above would be expected to have the following impacts to the valuations:
• Consumer Price Index/LIBOR basis swaps — These swaps do not actively trade in the markets as
indicated by a wide bid/ask spread. A wider bid/ask spread will result in a decrease in the overall
valuation.
• Prime/LIBOR basis swaps — These swaps do not actively trade in the markets as indicated by a wide
bid/ask spread. A wider bid/ask spread will result in a decrease in the overall valuation. In addition, the
unobservable inputs include Constant Prepayment Rates of the underlying securitization trust the swap
references. A decrease in this input will result in a longer weighted average life of the swap which will
increase the value for swaps in a gain position and decrease the value for swaps in a loss position,
everything else equal. The opposite is true for an increase in the input.
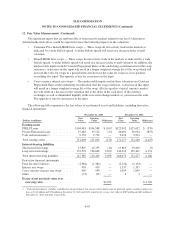
• Cross-currency interest rate swaps — The unobservable inputs used in these valuations are Constant
Prepayment Rates of the underlying securitization trust the swap references. A decrease in this input
will result in a longer weighted average life of the swap. All else equal in a typical currency market,
this will result in a decrease to the valuation due to the delay in the cash flows of the currency
exchanges as well as diminished liquidity in the forward exchange markets as you increase the term.
The opposite is true for an increase in the input.
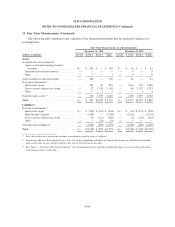
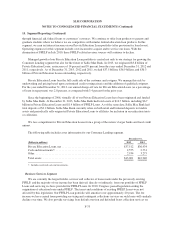
The following table summarizes the fair values of our financial assets and liabilities, including derivative
financial instruments.
December 31, 2013 December 31, 2012
(Dollars in millions)
Fair
Value
Carrying
Value Difference
Fair
Value
Carrying
Value Difference
Earning assets
FFELP Loans ....................... $104,481 $104,588 $ (107) $125,042 $125,612 $ (570)
Private Education Loans ............... 37,485 37,512 (27) 36,081 36,934 (853)
Cash and investments(1) ................ 9,732 9,732 — 9,994 9,994 —
Total earning assets ................... 151,698 151,832 (134) 171,117 172,540 (1,423)
Interest-bearing liabilities
Short-term borrowings ................ 13,807 13,795 (12) 19,861 19,856 (5)
Long-term borrowings ................ 133,578 136,648 3,070 146,210 152,401 6,191
Total interest-bearing liabilities ......... 147,385 150,443 3,058 166,071 172,257 6,186
Derivative financial instruments
Floor Income Contracts ............... (1,384) (1,384) — (2,154) (2,154) —
Interest rate swaps .................... 459 459 — 1,337 1,337 —
Cross-currency interest rate swaps ....... 999 999 — 1,099 1,099 —
Other .............................. (21) (21) — 4 4 —
Excess of net asset fair value over
carrying value .................... $2,924 $ 4,763
(1) “Cash and investments” includes available-for-sale investments that consist of investments that are primarily agency securities whose cost
basis is $113 million and $78 million at December 31, 2013 and 2012, respectively, versus a fair value of $109 million and $81 million at
December 31, 2013 and 2012, respectively.
F-67