Sallie Mae 2013 Annual Report Download - page 196
Download and view the complete annual report
Please find page 196 of the 2013 Sallie Mae annual report below. You can navigate through the pages in the report by either clicking on the pages listed below, or by using the keyword search tool below to find specific information within the annual report.-
 1
1 -
2
-
3
-
4
-
5
-
6
-
7
-
8
-
9
-
10
-
11
-
12
-
13
-
14
-
15
-
16
-
17
-
18
-
19
-
20
-
21
-
22
-
23
-
24
-
25
-
26
-
27
-
28
-
29
-
30
-
31
-
32
-
33
-
34
-
35
-
36
-
37
-
38
-
39
-
40
-
41
-
42
-
43
-
44
-
45
-
46
-
47
-
48
-
49
-
50
-
51
-
52
-
53
-
54
-
55
-
56
-
57
-
58
-
59
-
60
-
61
-
62
-
63
-
64
-
65
-
66
-
67
-
68
-
69
-
70
-
71
-
72
-
73
-
74
-
75
-
76
-
77
-
78
-
79
-
80
-
81
-
82
-
83
-
84
-
85
-
86
-
87
-
88
-
89
-
90
-
91
-
92
-
93
-
94
-
95
-
96
-
97
-
98
-
99
-
100
-
101
-
102
-
103
-
104
-
105
-
106
-
107
-
108
-
109
-
110
-
111
-
112
-
113
-
114
-
115
-
116
-
117
-
118
-
119
-
120
-
121
-
122
-
123
-
124
-
125
-
126
-
127
-
128
-
129
-
130
-
131
-
132
-
133
-
134
-
135
-
136
-
137
-
138
-
139
-
140
-
141
-
142
-
143
-
144
-
145
-
146
-
147
-
148
-
149
-
150
-
151
-
152
-
153
-
154
-
155
-
156
-
157
-
158
-
159
-
160
-
161
-
162
-
163
-
164
-
165
-
166
-
167
-
168
-
169
-
170
-
171
-
172
-
173
-
174
-
175
-
176
-
177
-
178
-
179
-
180
-
181
-
182
-
183
-
184
-
185
-
 186
186 -
 187
187 -
 188
188 -
 189
189 -
 190
190 -
 191
191 -
 192
192 -
 193
193 -
 194
194 -
 195
195 -
 196
196 -
 197
197 -
 198
198 -
 199
199 -
 200
200 -
 201
201 -
 202
202 -
 203
203 -
 204
204 -
 205
205 -
 206
206 -
207
-
208
-
209
-
210
-
211
-
212
-
213
-
214
-
215
-
216
-
217
-
218
-
219
-
220
-
221
-
222
-
223
-
224
-
225
-
226
-
227
-
228
-
229
-
230
-
231
-
232
 |
 |

SLM CORPORATION
NOTES TO CONSOLIDATED FINANCIAL STATEMENTS (Continued)
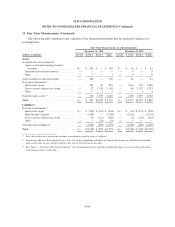
11. Stock-Based Compensation Plans and Arrangements (Continued)
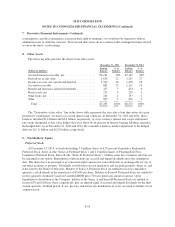
The total stock-based compensation cost recognized in the consolidated statements of income for 2013,
2012 and 2011 was $47 million, $47 million and $56 million, respectively. As of December 31, 2013, there was
$19 million of total unrecognized compensation expense related to unvested stock awards net of estimated
forfeitures, which is expected to be recognized over a weighted average period of 1.8 years. We amortize
compensation expense on a straight-line basis over the related vesting periods of each tranche of each award.
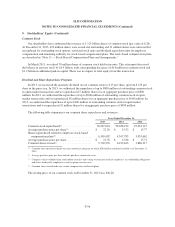
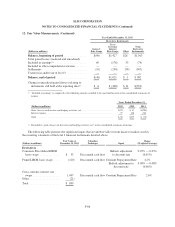
Stock Options
Stock options granted prior to 2012 expire 10 years after the grant date, and those granted since 2012 expire
in 5 years. The exercise price must be equal to or greater than the market price of our common stock on the grant
date. We have granted time-vested, price-vested and performance-vested options to our employees and non-
employee directors. Time-vested options granted to management and non-management employees generally vest
over three years. Price-vested options granted to management employees vest upon our common stock reaching a
targeted closing price for a set number of days. Performance-vested options granted to management employees
vest one-third per year for three years based on corporate earnings-related performance targets. Options granted
to non-employee directors vest upon the director’s election to the Board.
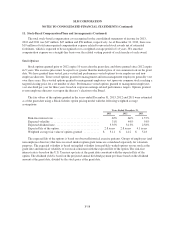
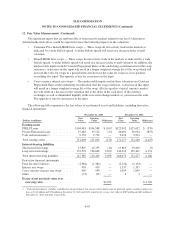
The fair values of the options granted in the years ended December 31, 2013, 2012 and 2011 were estimated
as of the grant date using a Black-Scholes option pricing model with the following weighted average
assumptions:
Years Ended December 31,
2013 2012 2011
Risk-free interest rate ................................ .65% .60% 1.57%
Expected volatility .................................. 31% 44% 54%
Expected dividend rate ............................... 3.35% 3.13% 2.58%
Expected life of the option ............................ 2.8years 2.8 years 4.1 years
Weighted average fair value of options granted ........... $ 3.11 $ 4.12 $ 5.18
The expected life of the options is based on observed historical exercise patterns. Groups of employees (and
non-employee directors) that have received similar option grant terms are considered separately for valuation
purposes. The expected volatility is based on implied volatility from publicly-traded options on our stock at the
grant date and historical volatility of our stock consistent with the expected life of the option. The risk-free
interest rate is based on the U.S. Treasury spot rate at the grant date consistent with the expected life of the
option. The dividend yield is based on the projected annual dividend payment per share based on the dividend
amount at the grant date, divided by the stock price at the grant date.
F-58