Sallie Mae 2013 Annual Report Download - page 177
Download and view the complete annual report
Please find page 177 of the 2013 Sallie Mae annual report below. You can navigate through the pages in the report by either clicking on the pages listed below, or by using the keyword search tool below to find specific information within the annual report.-
 1
1 -
2
-
3
-
4
-
5
-
6
-
7
-
8
-
9
-
10
-
11
-
12
-
13
-
14
-
15
-
16
-
17
-
18
-
19
-
20
-
21
-
22
-
23
-
24
-
25
-
26
-
27
-
28
-
29
-
30
-
31
-
32
-
33
-
34
-
35
-
36
-
37
-
38
-
39
-
40
-
41
-
42
-
43
-
44
-
45
-
46
-
47
-
48
-
49
-
50
-
51
-
52
-
53
-
54
-
55
-
56
-
57
-
58
-
59
-
60
-
61
-
62
-
63
-
64
-
65
-
66
-
67
-
68
-
69
-
70
-
71
-
72
-
73
-
74
-
75
-
76
-
77
-
78
-
79
-
80
-
81
-
82
-
83
-
84
-
85
-
86
-
87
-
88
-
89
-
90
-
91
-
92
-
93
-
94
-
95
-
96
-
97
-
98
-
99
-
100
-
101
-
102
-
103
-
104
-
105
-
106
-
107
-
108
-
109
-
110
-
111
-
112
-
113
-
114
-
115
-
116
-
117
-
118
-
119
-
120
-
121
-
122
-
123
-
124
-
125
-
126
-
127
-
128
-
129
-
130
-
131
-
132
-
133
-
134
-
135
-
136
-
137
-
138
-
139
-
140
-
141
-
142
-
143
-
144
-
145
-
146
-
147
-
148
-
149
-
150
-
151
-
152
-
153
-
154
-
155
-
156
-
157
-
158
-
159
-
160
-
161
-
162
-
163
-
164
-
165
-
166
-
 167
167 -
 168
168 -
 169
169 -
 170
170 -
 171
171 -
 172
172 -
 173
173 -
 174
174 -
 175
175 -
 176
176 -
 177
177 -
 178
178 -
 179
179 -
 180
180 -
 181
181 -
 182
182 -
 183
183 -
 184
184 -
 185
185 -
 186
186 -
 187
187 -
188
-
189
-
190
-
191
-
192
-
193
-
194
-
195
-
196
-
197
-
198
-
199
-
200
-
201
-
202
-
203
-
204
-
205
-
206
-
207
-
208
-
209
-
210
-
211
-
212
-
213
-
214
-
215
-
216
-
217
-
218
-
219
-
220
-
221
-
222
-
223
-
224
-
225
-
226
-
227
-
228
-
229
-
230
-
231
-
232
 |
 |

SLM CORPORATION
NOTES TO CONSOLIDATED FINANCIAL STATEMENTS (Continued)
5. Goodwill and Acquired Intangible Assets (Continued)
Goodwill Impairment Testing
We perform our goodwill impairment testing annually in the fourth quarter as of October 1. No goodwill
was deemed impaired in 2013. As part of the 2013 annual impairment testing, we retained a third-party appraisal
firm to assist in the valuations required to perform Step 1 impairment testing. The income approach was the
primary approach used to estimate the fair value of each reporting unit.
The income approach measures the value of each reporting unit’s future economic benefit determined by its
discounted cash flows derived from our projections plus an assumed terminal growth rate adjusted for what we
believe a market participant would assume in an acquisition. These projections are generally five-year
projections that reflect the anticipated cash flow fluctuations of the respective reporting units. If a component of a
reporting unit is winding down or is assumed to wind down, the projections extend through the anticipated wind-
down period and no residual value is ascribed.
Under our guidance, the third-party appraisal firm developed the discount rate for each reporting unit
incorporating such factors as the risk free rate, a market rate of return, a measure of volatility (Beta) and a
company-specific and capital markets risk premium, as appropriate, to adjust for volatility and uncertainty in the
economy and to capture specific risk related to the respective reporting units. We considered whether an asset
sale or an equity sale would be the most likely sale structure for each reporting unit and valued each reporting
unit based on the more likely hypothetical scenario.
The discount rates reflect market-based estimates of capital costs and are adjusted for our assessment of a
market participant’s view with respect to execution, source concentration and other risks associated with the
projected cash flows of individual reporting units. We reviewed and approved the discount rates provided by the
third-party appraiser including the factors incorporated to develop the discount rates for each reporting unit.
We and the third-party appraisal firm also considered a market approach for each reporting unit. Market-
based multiples for comparable publicly traded companies and similar transactions were evaluated as an indicator
of the value of the reporting units to assess the reasonableness of the estimated fair value derived from the
income approach.
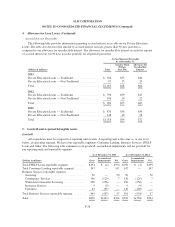
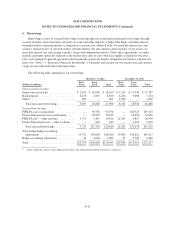
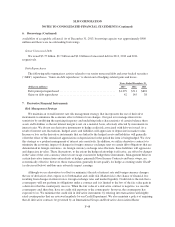
The following table illustrates the carrying value of equity for each reporting unit with remaining goodwill
as of December 31, 2013, and the percentage by which the estimated fair value determined in conjunction with
Step 1 impairment testing in the fourth quarter of 2013 exceeds the carrying value of equity.
(Dollars in millions)
Carrying Value
of Equity
% of Fair Value
in Excess of
Carrying Value
FFELP Loans ............................................ $ 930 202%
Consumer Lending ........................................ 4,335 80%
Servicing ............................................... 137 966%
Contingency Services ..................................... 53 193%
We acknowledge that continued weakness in the economy coupled with changes in legislation and the
regulatory environment could adversely affect the operating results of our reporting units. If the forecasted
performance of our reporting units is not achieved, or if our stock price declines resulting in deterioration in our
total market capitalization, the fair value of one or more of the reporting units could be significantly reduced, and
we may be required to record a charge, which could be material, for an impairment of goodwill.
F-39