Sallie Mae 2013 Annual Report Download - page 147
Download and view the complete annual report
Please find page 147 of the 2013 Sallie Mae annual report below. You can navigate through the pages in the report by either clicking on the pages listed below, or by using the keyword search tool below to find specific information within the annual report.-
 1
1 -
2
-
3
-
4
-
5
-
6
-
7
-
8
-
9
-
10
-
11
-
12
-
13
-
14
-
15
-
16
-
17
-
18
-
19
-
20
-
21
-
22
-
23
-
24
-
25
-
26
-
27
-
28
-
29
-
30
-
31
-
32
-
33
-
34
-
35
-
36
-
37
-
38
-
39
-
40
-
41
-
42
-
43
-
44
-
45
-
46
-
47
-
48
-
49
-
50
-
51
-
52
-
53
-
54
-
55
-
56
-
57
-
58
-
59
-
60
-
61
-
62
-
63
-
64
-
65
-
66
-
67
-
68
-
69
-
70
-
71
-
72
-
73
-
74
-
75
-
76
-
77
-
78
-
79
-
80
-
81
-
82
-
83
-
84
-
85
-
86
-
87
-
88
-
89
-
90
-
91
-
92
-
93
-
94
-
95
-
96
-
97
-
98
-
99
-
100
-
101
-
102
-
103
-
104
-
105
-
106
-
107
-
108
-
109
-
110
-
111
-
112
-
113
-
114
-
115
-
116
-
117
-
118
-
119
-
120
-
121
-
122
-
123
-
124
-
125
-
126
-
127
-
128
-
129
-
130
-
131
-
132
-
133
-
134
-
135
-
136
-
 137
137 -
 138
138 -
 139
139 -
 140
140 -
 141
141 -
 142
142 -
 143
143 -
 144
144 -
 145
145 -
 146
146 -
 147
147 -
 148
148 -
 149
149 -
 150
150 -
 151
151 -
 152
152 -
 153
153 -
 154
154 -
 155
155 -
 156
156 -
 157
157 -
158
-
159
-
160
-
161
-
162
-
163
-
164
-
165
-
166
-
167
-
168
-
169
-
170
-
171
-
172
-
173
-
174
-
175
-
176
-
177
-
178
-
179
-
180
-
181
-
182
-
183
-
184
-
185
-
186
-
187
-
188
-
189
-
190
-
191
-
192
-
193
-
194
-
195
-
196
-
197
-
198
-
199
-
200
-
201
-
202
-
203
-
204
-
205
-
206
-
207
-
208
-
209
-
210
-
211
-
212
-
213
-
214
-
215
-
216
-
217
-
218
-
219
-
220
-
221
-
222
-
223
-
224
-
225
-
226
-
227
-
228
-
229
-
230
-
231
-
232
 |
 |

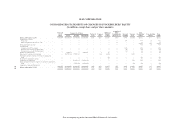
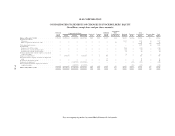
SLM CORPORATION
CONSOLIDATED STATEMENTS OF CHANGES IN STOCKHOLDERS’ EQUITY
(In millions, except share and per share amounts)
Preferred
Stock
Shares
Common Stock Shares Preferred
Stock
Common
Stock
Additional
Paid-In
Capital
Accumulated
Other
Comprehensive
Income (Loss)
Retained
Earnings
Treasury
Stock
Total
Stockholders’
Equity
Noncontrolling
Interest
Total
EquityIssued Treasury Outstanding
Balance at December 31, 2011 .......................... 7,300,000 529,075,322 (20,323,997) 508,751,325 $565 $106 $4,136 $(14) $ 770 $ (320) $5,243 $ 8 $5,251
Comprehensive income:
Net income ........................................ — — — — — — — — 939 — 939 (2) 937
Other comprehensive income, net of tax ................. — — — — — — — 8 — — 8 — 8
Total comprehensive income ............................ — — — — — — — — — — 947 (2) 945
Cash dividends:
Common stock ($.50 per share) ........................ — — — — — — — — (237) — (237) — (237)
Preferred stock, series A ($3.49 per share) ................ — — — — — — — — (11) — (11) — (11)
Preferred stock, series B ($2.22 per share) ................ — — — — — — — — (9) — (9) — (9)
Dividend equivalent units related to employee stock-based
compensation plans .................................. — — — — — — — — (1) — (1) — (1)
Issuance of common shares ............................. — 6,432,643 — 6,432,643 — 1 60 — — — 61 — 61
Tax benefit related to employee stock-based compensation
plans ............................................. — — — — — — (6) — — — (6) — (6)
Stock-based compensation expense ....................... — — — — — — 47 — — — 47 — 47
Common stock repurchased ............................. — — (58,038,239) (58,038,239) — — — — — (900) (900) — (900)
Shares repurchased related to employee stock-based
compensation plans .................................. — — (4,547,785) (4,547,785) — — — — — (74) (74) — (74)
Balance at December 31, 2012 .......................... 7,300,000 535,507,965 (82,910,021) 452,597,944 $565 $107 $4,237 $ (6) $1,451 $(1,294) $5,060 $ 6 $5,066
See accompanying notes to consolidated financial statements.
F-9