Sallie Mae 2013 Annual Report Download - page 68
Download and view the complete annual report
Please find page 68 of the 2013 Sallie Mae annual report below. You can navigate through the pages in the report by either clicking on the pages listed below, or by using the keyword search tool below to find specific information within the annual report.-
 1
1 -
2
-
3
-
4
-
5
-
6
-
7
-
8
-
9
-
10
-
11
-
12
-
13
-
14
-
15
-
16
-
17
-
18
-
19
-
20
-
21
-
22
-
23
-
24
-
25
-
26
-
27
-
28
-
29
-
30
-
31
-
32
-
33
-
34
-
35
-
36
-
37
-
38
-
39
-
40
-
41
-
42
-
43
-
44
-
45
-
46
-
47
-
48
-
49
-
50
-
51
-
52
-
53
-
54
-
55
-
56
-
57
-
 58
58 -
 59
59 -
 60
60 -
 61
61 -
 62
62 -
 63
63 -
 64
64 -
 65
65 -
 66
66 -
 67
67 -
 68
68 -
 69
69 -
 70
70 -
 71
71 -
 72
72 -
 73
73 -
 74
74 -
 75
75 -
 76
76 -
 77
77 -
 78
78 -
79
-
80
-
81
-
82
-
83
-
84
-
85
-
86
-
87
-
88
-
89
-
90
-
91
-
92
-
93
-
94
-
95
-
96
-
97
-
98
-
99
-
100
-
101
-
102
-
103
-
104
-
105
-
106
-
107
-
108
-
109
-
110
-
111
-
112
-
113
-
114
-
115
-
116
-
117
-
118
-
119
-
120
-
121
-
122
-
123
-
124
-
125
-
126
-
127
-
128
-
129
-
130
-
131
-
132
-
133
-
134
-
135
-
136
-
137
-
138
-
139
-
140
-
141
-
142
-
143
-
144
-
145
-
146
-
147
-
148
-
149
-
150
-
151
-
152
-
153
-
154
-
155
-
156
-
157
-
158
-
159
-
160
-
161
-
162
-
163
-
164
-
165
-
166
-
167
-
168
-
169
-
170
-
171
-
172
-
173
-
174
-
175
-
176
-
177
-
178
-
179
-
180
-
181
-
182
-
183
-
184
-
185
-
186
-
187
-
188
-
189
-
190
-
191
-
192
-
193
-
194
-
195
-
196
-
197
-
198
-
199
-
200
-
201
-
202
-
203
-
204
-
205
-
206
-
207
-
208
-
209
-
210
-
211
-
212
-
213
-
214
-
215
-
216
-
217
-
218
-
219
-
220
-
221
-
222
-
223
-
224
-
225
-
226
-
227
-
228
-
229
-
230
-
231
-
232
 |
 |
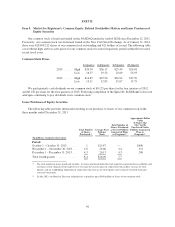
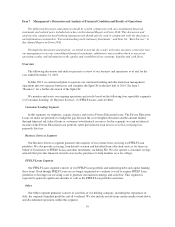
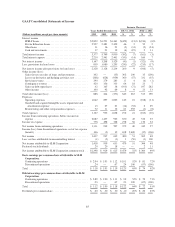
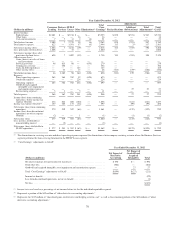
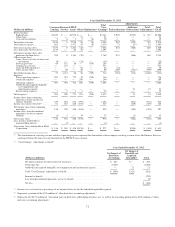
Consolidated Earnings Summary — GAAP-basis
Year Ended December 31, 2013 Compared with Year Ended December 31, 2012
For the years ended December 31, 2013 and 2012, net income was $1.4 billion, or $3.12 diluted earnings per
common share, and $939 million, or $1.90 diluted earnings per common share, respectively. The increase in net
income was primarily due to a $360 million decrease in net losses on derivative and hedging activities, a $302
million increase in gains on sales of loans and investments, a $241 million decrease in provisions for loan losses,
and a $108 million after-tax increase in income from discontinued operations, which were partially offset by
$103 million of lower gains on debt repurchases, higher operating expenses of $145 million and higher
restructuring and other reorganization expenses of $61 million.
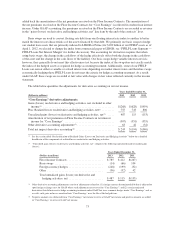
The primary contributors to each of the identified drivers of changes in net income for 2013 compared with
2012 are as follows:
• Net interest income decreased by $41 million in the current year compared with the prior year primarily
due to a reduction in FFELP net interest income from a $20 billion decline in average FFELP Loans
outstanding in part due to the sale of Residual Interests in FFELP Loan securitization trusts in the first
half of 2013. There were approximately $12 billion of FFELP Loans in these trusts.
• Provisions for loan losses decreased by $241 million primarily as a result of the overall improvement in
Private Education Loans’ credit quality, delinquency and charge-off trends leading to decreases in
expected future charge-offs.
• Gains on sales of loans and investments increased by $302 million as a result of $312 million in gains on
the sales of the Residual Interests in FFELP Loan securitization trusts in 2013. See the section titled
“Business Segment Earnings Summary — ‘Core Earnings’ Basis — FFELP Loans Segment” for further
discussion.
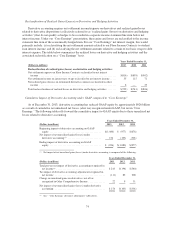
• Losses on derivative and hedging activities, net, resulted in a net loss of $268 million in 2013 compared
with a net loss of $628 million in 2012. The primary factors affecting the change were interest rate and
foreign currency fluctuations, which primarily affected the valuations of our Floor Income Contracts,
basis swaps and foreign currency hedges during each period. Valuations of derivative instruments vary
based upon many factors including changes in interest rates, credit risk, foreign currency fluctuations and
other market factors. As a result, net gains and losses on derivative and hedging activities may continue to
vary significantly in future periods.
• Servicing and contingency revenue increased $75 million from the prior year primarily from an increase
in the number of accounts serviced and in collection volumes in 2013.
• Gains on debt repurchases decreased $103 million. Debt repurchase activity will fluctuate based on
market fundamentals and our liability management strategy.
• Operating expenses increased $145 million primarily as a result of increases in our third-party servicing
and collection activities, increased Private Education Loan marketing activities, continued investments in
technology and an increase in compliance remediation expense. In the fourth quarter of 2013, we reserved
$70 million for estimated compliance remediation efforts relating to pending regulatory inquiries. For
additional information regarding these remediation efforts, see Item 3. “Legal Proceedings — Regulatory
Matters.”
• Restructuring and other reorganization expenses were $72 million compared with $11 million in the prior
year. For 2013, these consisted of $43 million primarily related to third-party costs incurred in connection
with our previously announced plan to separate our existing organization into two, separate, publicly
traded companies and $29 million related to severance costs. The $11 million of expenses in 2012 related
to restructuring expenses.
• The effective tax rates for 2013 and 2012 were 37 percent and 35 percent, respectively. The movement in
the effective tax rate was primarily driven by the impact of state law changes recorded in the year-ago
period.
66