Sallie Mae 2013 Annual Report Download - page 73
Download and view the complete annual report
Please find page 73 of the 2013 Sallie Mae annual report below. You can navigate through the pages in the report by either clicking on the pages listed below, or by using the keyword search tool below to find specific information within the annual report.-
 1
1 -
2
-
3
-
4
-
5
-
6
-
7
-
8
-
9
-
10
-
11
-
12
-
13
-
14
-
15
-
16
-
17
-
18
-
19
-
20
-
21
-
22
-
23
-
24
-
25
-
26
-
27
-
28
-
29
-
30
-
31
-
32
-
33
-
34
-
35
-
36
-
37
-
38
-
39
-
40
-
41
-
42
-
43
-
44
-
45
-
46
-
47
-
48
-
49
-
50
-
51
-
52
-
53
-
54
-
55
-
56
-
57
-
58
-
59
-
60
-
61
-
62
-
 63
63 -
 64
64 -
 65
65 -
 66
66 -
 67
67 -
 68
68 -
 69
69 -
 70
70 -
 71
71 -
 72
72 -
 73
73 -
 74
74 -
 75
75 -
 76
76 -
 77
77 -
 78
78 -
 79
79 -
 80
80 -
 81
81 -
 82
82 -
 83
83 -
84
-
85
-
86
-
87
-
88
-
89
-
90
-
91
-
92
-
93
-
94
-
95
-
96
-
97
-
98
-
99
-
100
-
101
-
102
-
103
-
104
-
105
-
106
-
107
-
108
-
109
-
110
-
111
-
112
-
113
-
114
-
115
-
116
-
117
-
118
-
119
-
120
-
121
-
122
-
123
-
124
-
125
-
126
-
127
-
128
-
129
-
130
-
131
-
132
-
133
-
134
-
135
-
136
-
137
-
138
-
139
-
140
-
141
-
142
-
143
-
144
-
145
-
146
-
147
-
148
-
149
-
150
-
151
-
152
-
153
-
154
-
155
-
156
-
157
-
158
-
159
-
160
-
161
-
162
-
163
-
164
-
165
-
166
-
167
-
168
-
169
-
170
-
171
-
172
-
173
-
174
-
175
-
176
-
177
-
178
-
179
-
180
-
181
-
182
-
183
-
184
-
185
-
186
-
187
-
188
-
189
-
190
-
191
-
192
-
193
-
194
-
195
-
196
-
197
-
198
-
199
-
200
-
201
-
202
-
203
-
204
-
205
-
206
-
207
-
208
-
209
-
210
-
211
-
212
-
213
-
214
-
215
-
216
-
217
-
218
-
219
-
220
-
221
-
222
-
223
-
224
-
225
-
226
-
227
-
228
-
229
-
230
-
231
-
232
 |
 |

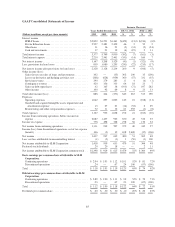
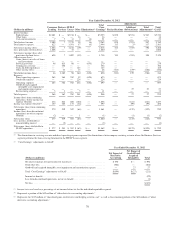
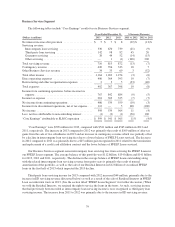
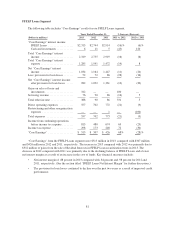
Year Ended December 31, 2011
(Dollars in millions)
Consumer
Lending
Business
Services
FFELP
Loans Other Eliminations(1)
Total
“Core
Earnings”
Adjustments
Total
GAAPReclassifications
Additions/
(Subtractions)
Total
Adjustments(2)
Interest income:
Student loans .................. $2,429 $ — $2,914 $ — $ — $5,343 $ 902 $(355) $ 547 $5,890
Other loans ................... — — — 21 — 21 — — — 21
Cash and investments ........... 9 8 5 5 (8) 19 — — — 19
Total interest income ............. 2,438 8 2,919 26 (8) 5,383 902 (355) 547 5,930
Total interest expense ............. 801 — 1,472 54 (8) 2,319 71 11(4) 82 2,401
Net interest income (loss) .......... 1,637 8 1,447 (28) — 3,064 831 (366) 465 3,529
Less: provisions for loan losses ..... 1,179 — 86 30 — 1,295 — — — 1,295
Net interest income (loss) after
provisions for loan losses ........ 458 8 1,361 (58) — 1,769 831 (366) 465 2,234
Other income (loss):
Gains (losses) on sales of loans and
investments ................. (9) — — (26) — (35) — — — (35)
Servicing revenue .............. 64 872 86 — (739) 283 — — — 283
Contingency revenue ........... — 333 — — — 333 — — — 333
Gains on debt repurchases ....... — — — 64 — 64 (26) — (26) 38
Other income (loss) ............ — 69 — 20 — 89 (805) (174)(5) (979) (890)
Total other income (loss) .......... 55 1,274 86 58 (739) 734 (831) (174) (1,005) (271)
Expenses:
Direct operating expenses ........ 291 393 772 19 (739) 736 — — — 736
Overhead expenses ............. — — — 269 — 269 — — — 269
Operating expenses ............. 291 393 772 288 (739) 1,005 — — — 1,005
Goodwill and acquired intangible
asset impairment and
amortization expense ......... — — — — — — — 21 21 21
Restructuring expenses .......... 3 5 1 3 — 12 — — — 12
Total expenses .................. 294 398 773 291 (739) 1,017 — 21 21 1,038
Income (loss) from continuing
operations, before income tax
expense (benefit) ............... 219 884 674 (291) — 1,486 — (561) (561) 925
Income tax expense (benefit)(3) ...... 81 325 248 (107) — 547 — (219) (219) 328
Net income (loss) from continuing
operations .................... 138 559 426 (184) — 939 — (342) (342) 597
Income (loss) from discontinued
operations, net of tax expense
(benefit) ..................... (2) 5 — 34 — 37 — (2) (2) 35
Net income (loss) ................ 136 564 426 (150) — 976 — (344) (344) 632
Less: net loss attributable to
noncontrolling interest .......... — (1) — — — (1) — — — (1)
Net income (loss) attributable to SLM
Corporation ................... $ 136 $ 565 $ 426 $(150) $ — $ 977 $ — $(344) $ (344) $ 633
(1) The eliminations in servicing revenue and direct operating expense represent the elimination of intercompany servicing revenue where the Business Services
segment performs the loan servicing function for the FFELP Loans segment.
(2) “Core Earnings” adjustments to GAAP:
Year Ended December 31, 2011
(Dollars in millions)
Net Impact of
Derivative
Accounting
Net Impact of
Goodwill and
Acquired
Intangibles Total
Net interest income after provisions for loan losses ........................... $ 465 $— $ 465
Total other loss ....................................................... (1,005) — (1,005)
Goodwill and acquired intangible asset impairment and amortization expense ...... — 21 21
Total “Core Earnings” adjustments to GAAP ............................... $ (540) $ (21) (561)
Income tax benefit .................................................... (219)
Loss from discontinued operations, net of tax benefit ......................... (2)
Net loss ............................................................. $ (344)
(3) Income taxes are based on a percentage of net income before tax for the individual reportable segment.
(4) Represents a portion of the $(32) million of “other derivative accounting adjustments.”
(5) Represents the $(153) million of “unrealized gains on derivative and hedging activities, net” as well as the remaining portion of the $(32) million of “other
derivative accounting adjustments.”
71