Sallie Mae 2013 Annual Report Download - page 199
Download and view the complete annual report
Please find page 199 of the 2013 Sallie Mae annual report below. You can navigate through the pages in the report by either clicking on the pages listed below, or by using the keyword search tool below to find specific information within the annual report.-
 1
1 -
2
-
3
-
4
-
5
-
6
-
7
-
8
-
9
-
10
-
11
-
12
-
13
-
14
-
15
-
16
-
17
-
18
-
19
-
20
-
21
-
22
-
23
-
24
-
25
-
26
-
27
-
28
-
29
-
30
-
31
-
32
-
33
-
34
-
35
-
36
-
37
-
38
-
39
-
40
-
41
-
42
-
43
-
44
-
45
-
46
-
47
-
48
-
49
-
50
-
51
-
52
-
53
-
54
-
55
-
56
-
57
-
58
-
59
-
60
-
61
-
62
-
63
-
64
-
65
-
66
-
67
-
68
-
69
-
70
-
71
-
72
-
73
-
74
-
75
-
76
-
77
-
78
-
79
-
80
-
81
-
82
-
83
-
84
-
85
-
86
-
87
-
88
-
89
-
90
-
91
-
92
-
93
-
94
-
95
-
96
-
97
-
98
-
99
-
100
-
101
-
102
-
103
-
104
-
105
-
106
-
107
-
108
-
109
-
110
-
111
-
112
-
113
-
114
-
115
-
116
-
117
-
118
-
119
-
120
-
121
-
122
-
123
-
124
-
125
-
126
-
127
-
128
-
129
-
130
-
131
-
132
-
133
-
134
-
135
-
136
-
137
-
138
-
139
-
140
-
141
-
142
-
143
-
144
-
145
-
146
-
147
-
148
-
149
-
150
-
151
-
152
-
153
-
154
-
155
-
156
-
157
-
158
-
159
-
160
-
161
-
162
-
163
-
164
-
165
-
166
-
167
-
168
-
169
-
170
-
171
-
172
-
173
-
174
-
175
-
176
-
177
-
178
-
179
-
180
-
181
-
182
-
183
-
184
-
185
-
186
-
187
-
188
-
 189
189 -
 190
190 -
 191
191 -
 192
192 -
 193
193 -
 194
194 -
 195
195 -
 196
196 -
 197
197 -
 198
198 -
 199
199 -
 200
200 -
 201
201 -
 202
202 -
 203
203 -
 204
204 -
 205
205 -
 206
206 -
 207
207 -
 208
208 -
 209
209 -
210
-
211
-
212
-
213
-
214
-
215
-
216
-
217
-
218
-
219
-
220
-
221
-
222
-
223
-
224
-
225
-
226
-
227
-
228
-
229
-
230
-
231
-
232
 |
 |
SLM CORPORATION
NOTES TO CONSOLIDATED FINANCIAL STATEMENTS (Continued)
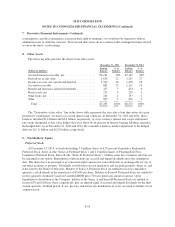
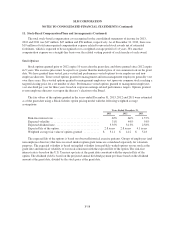
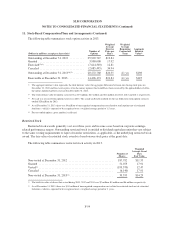
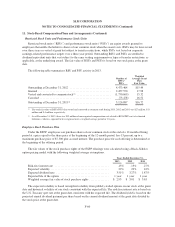
11. Stock-Based Compensation Plans and Arrangements (Continued)
The fair values were amortized to compensation cost on a straight-line basis over a one-year vesting period.
As of December 31, 2013, there was $.1 million of unrecognized compensation cost related to the ESPP net of
estimated forfeitures, which is expected to be recognized in January 2014.
During 2013, 2012 and 2011, plan participants purchased 218,389 shares, 192,755 shares and
278,266 shares, respectively, of our common stock.
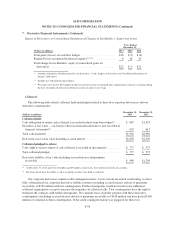
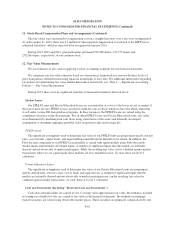
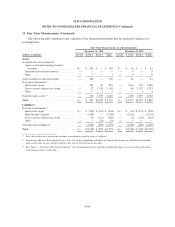
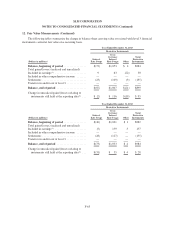
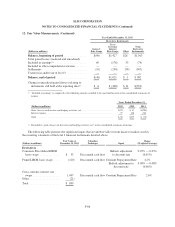
12. Fair Value Measurements
We use estimates of fair value in applying various accounting standards for our financial statements.
We categorize our fair value estimates based on a hierarchical framework associated with three levels of
price transparency utilized in measuring financial instruments at fair value. For additional information regarding
our policies for determining fair value and the hierarchical framework, see “Note 2 — Significant Accounting
Policies — Fair Value Measurement.”
During 2013, there were no significant transfers of financial instruments between levels.
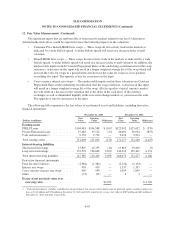
Student Loans
Our FFELP Loans and Private Education Loans are accounted for at cost or at the lower of cost or market if
the loan is held-for-sale. FFELP Loans classified as held-for-sale are those which we have the ability and intent
to sell under various ED loan purchase programs. In these instances, the FFELP Loans are valued using the
committed sales price under the programs. For all other FFELP Loans and Private Education Loans, fair values
were determined by modeling loan cash flows using stated terms of the assets and internally-developed
assumptions to determine aggregate portfolio yield, net present value and average life.
FFELP Loans
The significant assumptions used to determine fair value of our FFELP loans are prepayment speeds, default
rates, cost of funds, capital levels, and expected Repayment Borrower Benefits to be earned. In addition, the
Floor Income component of our FFELP Loan portfolio is valued with option models using both observable
market inputs and internally developed inputs. A number of significant inputs into the models are internally
derived and not observable to market participants. While the resulting fair value can be validated against market
transactions where we are a participant, these markets are not considered active. As such, these are level 3
valuations.
Private Education Loans
The significant assumptions used to determine fair value of our Private Education Loans are prepayment
speeds, default rates, recovery rates, cost of funds and capital levels. A number of significant inputs into the
models are internally derived and not observable to market participants nor can the resulting fair values be
validated against market transactions. As such, these are level 3 valuations.
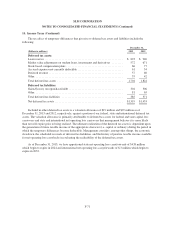
Cash and Investments (Including “Restricted Cash and Investments”)
Cash and cash equivalents are carried at cost. Carrying value approximates fair value. Investments classified
as trading or available-for-sale are carried at fair value in the financial statements. Investments in mortgage-
backed securities are valued using observable market prices. These securities are primarily collateralized by real
F-61