Sallie Mae 2013 Annual Report Download - page 38
Download and view the complete annual report
Please find page 38 of the 2013 Sallie Mae annual report below. You can navigate through the pages in the report by either clicking on the pages listed below, or by using the keyword search tool below to find specific information within the annual report.-
 1
1 -
2
-
3
-
4
-
5
-
6
-
7
-
8
-
9
-
10
-
11
-
12
-
13
-
14
-
15
-
16
-
17
-
18
-
19
-
20
-
21
-
22
-
23
-
24
-
25
-
26
-
27
-
 28
28 -
 29
29 -
 30
30 -
 31
31 -
 32
32 -
 33
33 -
 34
34 -
 35
35 -
 36
36 -
 37
37 -
 38
38 -
 39
39 -
 40
40 -
 41
41 -
 42
42 -
 43
43 -
 44
44 -
 45
45 -
 46
46 -
 47
47 -
 48
48 -
49
-
50
-
51
-
52
-
53
-
54
-
55
-
56
-
57
-
58
-
59
-
60
-
61
-
62
-
63
-
64
-
65
-
66
-
67
-
68
-
69
-
70
-
71
-
72
-
73
-
74
-
75
-
76
-
77
-
78
-
79
-
80
-
81
-
82
-
83
-
84
-
85
-
86
-
87
-
88
-
89
-
90
-
91
-
92
-
93
-
94
-
95
-
96
-
97
-
98
-
99
-
100
-
101
-
102
-
103
-
104
-
105
-
106
-
107
-
108
-
109
-
110
-
111
-
112
-
113
-
114
-
115
-
116
-
117
-
118
-
119
-
120
-
121
-
122
-
123
-
124
-
125
-
126
-
127
-
128
-
129
-
130
-
131
-
132
-
133
-
134
-
135
-
136
-
137
-
138
-
139
-
140
-
141
-
142
-
143
-
144
-
145
-
146
-
147
-
148
-
149
-
150
-
151
-
152
-
153
-
154
-
155
-
156
-
157
-
158
-
159
-
160
-
161
-
162
-
163
-
164
-
165
-
166
-
167
-
168
-
169
-
170
-
171
-
172
-
173
-
174
-
175
-
176
-
177
-
178
-
179
-
180
-
181
-
182
-
183
-
184
-
185
-
186
-
187
-
188
-
189
-
190
-
191
-
192
-
193
-
194
-
195
-
196
-
197
-
198
-
199
-
200
-
201
-
202
-
203
-
204
-
205
-
206
-
207
-
208
-
209
-
210
-
211
-
212
-
213
-
214
-
215
-
216
-
217
-
218
-
219
-
220
-
221
-
222
-
223
-
224
-
225
-
226
-
227
-
228
-
229
-
230
-
231
-
232
 |
 |

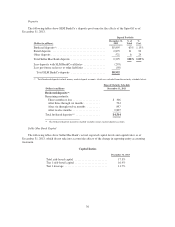
Deposits
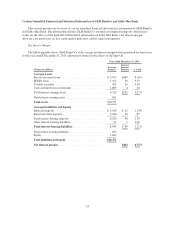
The following tables show SLM BankCo’s deposits pro forma for the effects of the Spin-Off as of
December 31, 2013.
Deposit Portfolio
(Dollars in millions)
December 31,
2013
%of
Total
%
Cost
Brokered deposits(1) ................................. $5,895 63% 1.15%
Retail deposits ..................................... 2,879 31 .93
Other deposits ...................................... 521 6 .24
Total Sallie Mae Bank deposits ........................ 9,295 100% 1.03%
Less deposits with SLM BankCo affiliates ............... (293)
Less pro forma reclasses to other liabilities ............... (50)
Total SLM BankCo deposits ........................ $8,952
(1) Total brokered deposits include money market deposit accounts, which are excluded from the maturity schedule below.
Deposit Maturity Schedule
(Dollars in millions) December 31, 2013
Brokered deposits(a)
Remaining maturity:
Three months or less ................... $ 306
After three through six months ........... 534
After six through twelve months ......... 897
After twelve months ................... 2,807
Total brokered deposits(a) ................. $4,544
(a) The brokered deposits maturity schedule excludes money market deposit accounts.
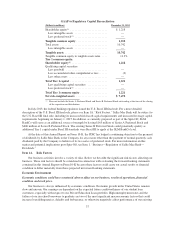
Sallie Mae Bank Capital
The following tables show Sallie Mae Bank’s actual, reported capital levels and capital ratios as of
December 31, 2013, which do not take into account the effects of the change in reporting entity accounting
treatment.
Capital Ratios
December 31, 2013
Total risk-based capital ....................... 17.3%
Tier 1 risk-based capital ....................... 16.4%
Tier 1 leverage .............................. 11.7%
36