Sallie Mae 2013 Annual Report Download - page 70
Download and view the complete annual report
Please find page 70 of the 2013 Sallie Mae annual report below. You can navigate through the pages in the report by either clicking on the pages listed below, or by using the keyword search tool below to find specific information within the annual report.-
 1
1 -
2
-
3
-
4
-
5
-
6
-
7
-
8
-
9
-
10
-
11
-
12
-
13
-
14
-
15
-
16
-
17
-
18
-
19
-
20
-
21
-
22
-
23
-
24
-
25
-
26
-
27
-
28
-
29
-
30
-
31
-
32
-
33
-
34
-
35
-
36
-
37
-
38
-
39
-
40
-
41
-
42
-
43
-
44
-
45
-
46
-
47
-
48
-
49
-
50
-
51
-
52
-
53
-
54
-
55
-
56
-
57
-
58
-
59
-
 60
60 -
 61
61 -
 62
62 -
 63
63 -
 64
64 -
 65
65 -
 66
66 -
 67
67 -
 68
68 -
 69
69 -
 70
70 -
 71
71 -
 72
72 -
 73
73 -
 74
74 -
 75
75 -
 76
76 -
 77
77 -
 78
78 -
 79
79 -
 80
80 -
81
-
82
-
83
-
84
-
85
-
86
-
87
-
88
-
89
-
90
-
91
-
92
-
93
-
94
-
95
-
96
-
97
-
98
-
99
-
100
-
101
-
102
-
103
-
104
-
105
-
106
-
107
-
108
-
109
-
110
-
111
-
112
-
113
-
114
-
115
-
116
-
117
-
118
-
119
-
120
-
121
-
122
-
123
-
124
-
125
-
126
-
127
-
128
-
129
-
130
-
131
-
132
-
133
-
134
-
135
-
136
-
137
-
138
-
139
-
140
-
141
-
142
-
143
-
144
-
145
-
146
-
147
-
148
-
149
-
150
-
151
-
152
-
153
-
154
-
155
-
156
-
157
-
158
-
159
-
160
-
161
-
162
-
163
-
164
-
165
-
166
-
167
-
168
-
169
-
170
-
171
-
172
-
173
-
174
-
175
-
176
-
177
-
178
-
179
-
180
-
181
-
182
-
183
-
184
-
185
-
186
-
187
-
188
-
189
-
190
-
191
-
192
-
193
-
194
-
195
-
196
-
197
-
198
-
199
-
200
-
201
-
202
-
203
-
204
-
205
-
206
-
207
-
208
-
209
-
210
-
211
-
212
-
213
-
214
-
215
-
216
-
217
-
218
-
219
-
220
-
221
-
222
-
223
-
224
-
225
-
226
-
227
-
228
-
229
-
230
-
231
-
232
 |
 |
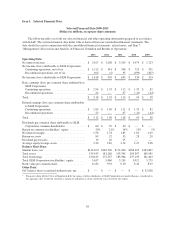
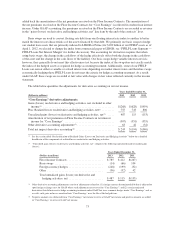
In addition, we repurchased 58 million shares and 19 million shares of our common stock during 2012 and
2011, respectively, as part of our common share repurchase program. Primarily as a result of these repurchases,
our average outstanding diluted shares decreased by 40 million common shares in 2012.
“Core Earnings” — Definition and Limitations
We prepare financial statements in accordance with GAAP. However, we also evaluate our business
segments on a basis that differs from GAAP. We refer to this different basis of presentation as “Core Earnings.”
We provide this “Core Earnings” basis of presentation on a consolidated basis for each business segment because
this is what we review internally when making management decisions regarding our performance and how we
allocate resources. We also refer to this information in our presentations with credit rating agencies, lenders and
investors. Because our “Core Earnings” basis of presentation corresponds to our segment financial presentations,
we are required by GAAP to provide “Core Earnings” disclosure in the notes to our consolidated financial
statements for our business segments. For additional information, see “Note 15 — Segment Reporting.”
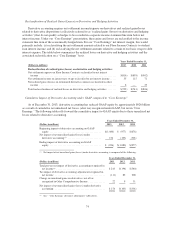
“Core Earnings” are not a substitute for reported results under GAAP. We use “Core Earnings” to manage
each business segment because “Core Earnings” reflect adjustments to GAAP financial results for two items,
discussed below, that create significant volatility mostly due to timing factors generally beyond the control of
management. Accordingly, we believe that “Core Earnings” provide management with a useful basis from which
to better evaluate results from ongoing operations against the business plan or against results from prior periods.
Consequently, we disclose this information as we believe it provides investors with additional information
regarding the operational and performance indicators that are most closely assessed by management. The two
items for which we adjust our “Core Earnings” presentations are (1) our use of derivative instruments to hedge
our economic risks that do not qualify for hedge accounting treatment or do qualify for hedge accounting
treatment but result in ineffectiveness and (2) the accounting for goodwill and acquired intangible assets.
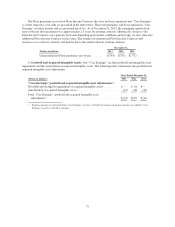
While GAAP provides a uniform, comprehensive basis of accounting, for the reasons described above, our
“Core Earnings” basis of presentation does not. “Core Earnings” are subject to certain general and specific
limitations that investors should carefully consider. For example, there is no comprehensive, authoritative
guidance for management reporting. Our “Core Earnings” are not defined terms within GAAP and may not be
comparable to similarly titled measures reported by other companies. Accordingly, our “Core Earnings”
presentation does not represent a comprehensive basis of accounting. Investors, therefore, may not be able to
compare our performance with that of other financial services companies based upon “Core Earnings.” “Core
Earnings” results are only meant to supplement GAAP results by providing additional information regarding the
operational and performance indicators that are most closely used by management, our Board of Directors, rating
agencies, lenders and investors to assess performance.
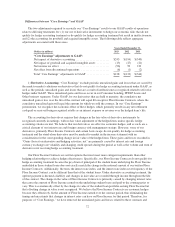
Specific adjustments that management makes to GAAP results to derive our “Core Earnings” basis of
presentation are described in detail in the section titled “‘Core Earnings’ — Definition and Limitations —
Differences between ‘Core Earnings’ and GAAP” of this Item 7.
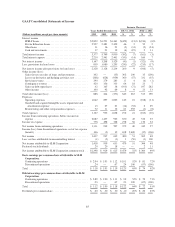
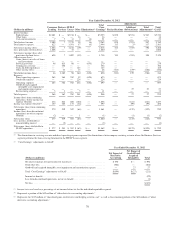
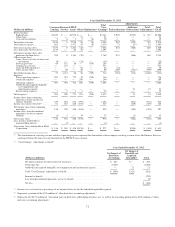
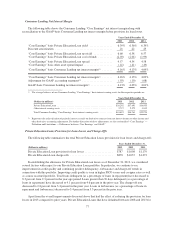
The following tables show “Core Earnings” for each business segment and our business as a whole along
with the adjustments made to the income/expense items to reconcile the amounts to our reported GAAP results as
required by GAAP and reported in “Note 15 — Segment Reporting.”
68