Sallie Mae 2013 Annual Report Download - page 198
Download and view the complete annual report
Please find page 198 of the 2013 Sallie Mae annual report below. You can navigate through the pages in the report by either clicking on the pages listed below, or by using the keyword search tool below to find specific information within the annual report.-
 1
1 -
2
-
3
-
4
-
5
-
6
-
7
-
8
-
9
-
10
-
11
-
12
-
13
-
14
-
15
-
16
-
17
-
18
-
19
-
20
-
21
-
22
-
23
-
24
-
25
-
26
-
27
-
28
-
29
-
30
-
31
-
32
-
33
-
34
-
35
-
36
-
37
-
38
-
39
-
40
-
41
-
42
-
43
-
44
-
45
-
46
-
47
-
48
-
49
-
50
-
51
-
52
-
53
-
54
-
55
-
56
-
57
-
58
-
59
-
60
-
61
-
62
-
63
-
64
-
65
-
66
-
67
-
68
-
69
-
70
-
71
-
72
-
73
-
74
-
75
-
76
-
77
-
78
-
79
-
80
-
81
-
82
-
83
-
84
-
85
-
86
-
87
-
88
-
89
-
90
-
91
-
92
-
93
-
94
-
95
-
96
-
97
-
98
-
99
-
100
-
101
-
102
-
103
-
104
-
105
-
106
-
107
-
108
-
109
-
110
-
111
-
112
-
113
-
114
-
115
-
116
-
117
-
118
-
119
-
120
-
121
-
122
-
123
-
124
-
125
-
126
-
127
-
128
-
129
-
130
-
131
-
132
-
133
-
134
-
135
-
136
-
137
-
138
-
139
-
140
-
141
-
142
-
143
-
144
-
145
-
146
-
147
-
148
-
149
-
150
-
151
-
152
-
153
-
154
-
155
-
156
-
157
-
158
-
159
-
160
-
161
-
162
-
163
-
164
-
165
-
166
-
167
-
168
-
169
-
170
-
171
-
172
-
173
-
174
-
175
-
176
-
177
-
178
-
179
-
180
-
181
-
182
-
183
-
184
-
185
-
186
-
187
-
 188
188 -
 189
189 -
 190
190 -
 191
191 -
 192
192 -
 193
193 -
 194
194 -
 195
195 -
 196
196 -
 197
197 -
 198
198 -
 199
199 -
 200
200 -
 201
201 -
 202
202 -
 203
203 -
 204
204 -
 205
205 -
 206
206 -
 207
207 -
 208
208 -
209
-
210
-
211
-
212
-
213
-
214
-
215
-
216
-
217
-
218
-
219
-
220
-
221
-
222
-
223
-
224
-
225
-
226
-
227
-
228
-
229
-
230
-
231
-
232
 |
 |

SLM CORPORATION
NOTES TO CONSOLIDATED FINANCIAL STATEMENTS (Continued)
11. Stock-Based Compensation Plans and Arrangements (Continued)
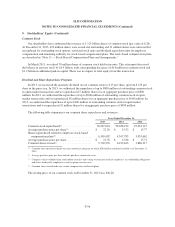
Restricted Stock Units and Performance Stock Units
Restricted stock units (“RSUs”) and performance stock units (“PSUs”) are equity awards granted to
employees that entitle the holder to shares of our common stock when the award vests. RSUs may be time-vested
over three years or vested at grant but subject to transfer restrictions, while PSUs vest based on corporate
earnings-related performance targets over a three-year period. Outstanding RSUs and PSUs are entitled to
dividend equivalent units that vest subject to the same vesting requirements or lapse of transfer restrictions, as
applicable, as the underlying award. The fair value of RSUs and PSUs is based on our stock price at the grant
date.
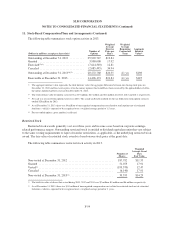
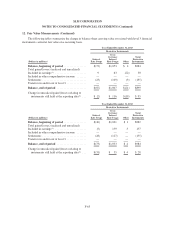
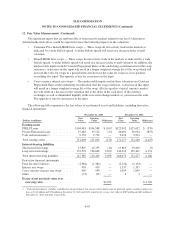
The following table summarizes RSU and PSU activity in 2013.
Number of
RSUs/
PSUs
Weighted
Average Grant
Date
Fair Value
Outstanding at December 31, 2012 ............................. 4,473,464 $15.49
Granted ................................................... 2,457,570 17.98
Vested and converted to common stock(1) ........................ (1,730,669) 15.32
Canceled .................................................. (73,478) 16.52
Outstanding at December 31, 2013(2) ............................ 5,126,887 $16.72
(1) The total fair value of RSUs/PSUs that vested and converted to common stock during 2013, 2012 and 2011 was $27 million, $13
million and $.4 million, respectively.
(2) As of December 31, 2013, there was $15 million of unrecognized compensation cost related to RSUs/PSUs net of estimated
forfeitures, which is expected to be recognized over a weighted average period of 1.8 years.
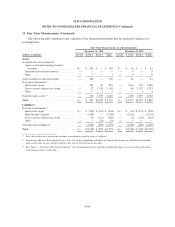
Employee Stock Purchase Plan
Under the ESPP, employees can purchase shares of our common stock at the end of a 12-month offering
period at a price equal to the share price at the beginning of the 12-month period, less 15 percent, up to a
maximum purchase price of $7,500 plus accrued interest. The purchase price for each offering is determined at
the beginning of the offering period.
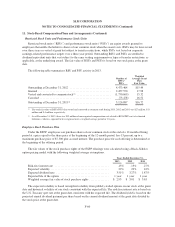
The fair values of the stock purchase rights of the ESPP offerings were calculated using a Black-Scholes
option pricing model with the following weighted average assumptions.
Years Ended December 31,
2013 2012 2011
Risk-free interest rate ...................................... .15% .13% .27%
Expected volatility ......................................... 29% 29% 42%
Expected dividend rate ..................................... 3.51% 3.27% 1.87%
Expected life of the option .................................. 1year 1 year 1 year
Weighted average fair value of stock purchase rights .............. $ 2.95 $ 3.01 $ 3.63
The expected volatility is based on implied volatility from publicly-traded options on our stock at the grant
date and historical volatility of our stock consistent with the expected life. The risk-free interest rate is based on
the U.S. Treasury spot rate at the grant date consistent with the expected life. The dividend yield is based on the
projected annual dividend payment per share based on the current dividend amount at the grant date divided by
the stock price at the grant date.
F-60