Sallie Mae 2013 Annual Report Download - page 217
Download and view the complete annual report
Please find page 217 of the 2013 Sallie Mae annual report below. You can navigate through the pages in the report by either clicking on the pages listed below, or by using the keyword search tool below to find specific information within the annual report.-
 1
1 -
2
-
3
-
4
-
5
-
6
-
7
-
8
-
9
-
10
-
11
-
12
-
13
-
14
-
15
-
16
-
17
-
18
-
19
-
20
-
21
-
22
-
23
-
24
-
25
-
26
-
27
-
28
-
29
-
30
-
31
-
32
-
33
-
34
-
35
-
36
-
37
-
38
-
39
-
40
-
41
-
42
-
43
-
44
-
45
-
46
-
47
-
48
-
49
-
50
-
51
-
52
-
53
-
54
-
55
-
56
-
57
-
58
-
59
-
60
-
61
-
62
-
63
-
64
-
65
-
66
-
67
-
68
-
69
-
70
-
71
-
72
-
73
-
74
-
75
-
76
-
77
-
78
-
79
-
80
-
81
-
82
-
83
-
84
-
85
-
86
-
87
-
88
-
89
-
90
-
91
-
92
-
93
-
94
-
95
-
96
-
97
-
98
-
99
-
100
-
101
-
102
-
103
-
104
-
105
-
106
-
107
-
108
-
109
-
110
-
111
-
112
-
113
-
114
-
115
-
116
-
117
-
118
-
119
-
120
-
121
-
122
-
123
-
124
-
125
-
126
-
127
-
128
-
129
-
130
-
131
-
132
-
133
-
134
-
135
-
136
-
137
-
138
-
139
-
140
-
141
-
142
-
143
-
144
-
145
-
146
-
147
-
148
-
149
-
150
-
151
-
152
-
153
-
154
-
155
-
156
-
157
-
158
-
159
-
160
-
161
-
162
-
163
-
164
-
165
-
166
-
167
-
168
-
169
-
170
-
171
-
172
-
173
-
174
-
175
-
176
-
177
-
178
-
179
-
180
-
181
-
182
-
183
-
184
-
185
-
186
-
187
-
188
-
189
-
190
-
191
-
192
-
193
-
194
-
195
-
196
-
197
-
198
-
199
-
200
-
201
-
202
-
203
-
204
-
205
-
206
-
 207
207 -
 208
208 -
 209
209 -
 210
210 -
 211
211 -
 212
212 -
 213
213 -
 214
214 -
 215
215 -
 216
216 -
 217
217 -
 218
218 -
 219
219 -
 220
220 -
 221
221 -
 222
222 -
 223
223 -
 224
224 -
 225
225 -
 226
226 -
 227
227 -
228
-
229
-
230
-
231
-
232
 |
 |

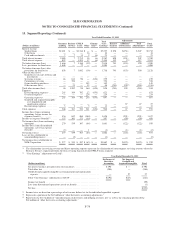
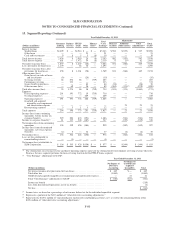
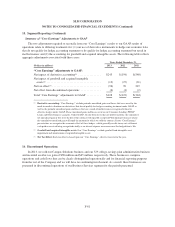
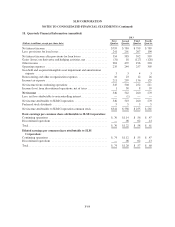
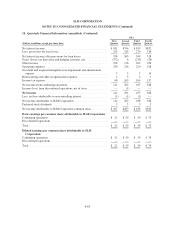
SLM CORPORATION
NOTES TO CONSOLIDATED FINANCIAL STATEMENTS (Continued)
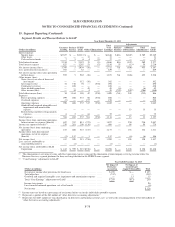
15. Segment Reporting (Continued)
Year Ended December 31, 2012
(Dollars in millions)
Consumer
Lending
Business
Services
FFELP
Loans Other
Elimina-
tions(1)
Total
“Core
Earnings”
Adjustments
Total
GAAP
Reclassi-
fications
Additions/
(Subtractions)
Total
Adjustments(2)
Interest income:
Student loans ................. $2,481 $ — $2,744 $ — $ — $5,225 $ 858 $(351) $ 507 $5,732
Other loans .................. — — — 16 — 16 — — — 16
Cash and investments .......... 7 7 11 2 (6) 21 — — — 21
Total interest income ............. 2,488 7 2,755 18 (6) 5,262 858 (351) 507 5,769
Total interest expense ............ 822 — 1,591 37 (6) 2,444 115 2(4) 117 2,561
Net interest income (loss) ......... 1,666 7 1,164 (19) — 2,818 743 (353) 390 3,208
Less: provisions for loan losses ..... 1,008 — 72 — — 1,080 — — — 1,080
Net interest income (loss) after
provisions for loan losses ....... 658 7 1,092 (19) — 1,738 743 (353) 390 2,128
Other income (loss):
Gain (losses) on sales of loans and
investments ................ ————— —— — — —
Servicing revenue ............. 46 813 90 — (670) 279 — — — 279
Contingency revenue ........... — 356 — — — 356 — — — 356
Gains on debt repurchases ....... — — — 145 — 145 — — — 145
Other income (loss) ............ — 33 — 15 — 48 (743) 159(5) (584) (536)
Total other income (loss) .......... 46 1,202 90 160 (670) 828 (743) 159 (584) 244
Expenses:
Direct operating expenses ....... 265 364 702 12 (670) 673 — — — 673
Overhead expenses ............ — — — 224 — 224 — — — 224
Operating expenses ............ 265 364 702 236 (670) 897 — — — 897
Goodwill and acquired intangible
asset impairment and
amortization expense ......... ————— —— 27 27 27
Restructuring expenses ......... 3 3 — 5 — 11 — — — 11
Total expenses .................. 268 367 702 241 (670) 908 — 27 27 935
Income (loss) from continuing
operations, before income tax
expense (benefit) .............. 436 842 480 (100) — 1,658 — (221) (221) 1,437
Income tax expense (benefit)(3) ..... 157 303 173 (36) — 597 — (99) (99) 498
Net income (loss) from continuing
operations ................... 279 539 307 (64) — 1,061 — (122) (122) 939
Income (loss) from discontinued
operations, net of tax expense
(benefit) ..................... (2) — — 1 — (1) — (1) (1) (2)
Net income (loss) ............... 277 539 307 (63) — 1,060 — (123) (123) 937
Less: net loss attributable to
noncontrolling interest .......... — (2) — — — (2) — — — (2)
Net income (loss) attributable to
SLM Corporation ............. $ 277 $ 541 $ 307 $ (63) $ — $1,062 $ — $(123) $(123) $ 939
(1) The eliminations in servicing revenue and direct operating expense represent the elimination of intercompany servicing revenue where the
Business Services segment performs the loan servicing function for the FFELP Loans segment.
(2) “Core Earnings” adjustments to GAAP:
Year Ended December 31, 2012
(Dollars in millions)
Net Impact of
Derivative
Accounting
Net Impact of
Goodwill and
Acquired Intangibles Total
Net interest income after provisions for loan losses .................... $390 $— $390
Total other loss ................................................. (584) — (584)
Goodwill and acquired intangible asset impairment and amortization
expense ..................................................... —2727
Total “Core Earnings” adjustments to GAAP ......................... $(194) $(27) (221)
Income tax benefit .............................................. (99)
Loss from discontinued operations, net of tax benefit ................... (1)
Net loss ....................................................... $(123)
(3) Income taxes are based on a percentage of net income before tax for the individual reportable segment.
(4) Represents a portion of the $42 million of “other derivative accounting adjustments.”
(5) Represents the $115 million of “unrealized gains on derivative and hedging activities, net” as well as the remaining portion of the
$42 million of “other derivative accounting adjustments.”
F-79