Sallie Mae 2013 Annual Report Download - page 92
Download and view the complete annual report
Please find page 92 of the 2013 Sallie Mae annual report below. You can navigate through the pages in the report by either clicking on the pages listed below, or by using the keyword search tool below to find specific information within the annual report.-
 1
1 -
2
-
3
-
4
-
5
-
6
-
7
-
8
-
9
-
10
-
11
-
12
-
13
-
14
-
15
-
16
-
17
-
18
-
19
-
20
-
21
-
22
-
23
-
24
-
25
-
26
-
27
-
28
-
29
-
30
-
31
-
32
-
33
-
34
-
35
-
36
-
37
-
38
-
39
-
40
-
41
-
42
-
43
-
44
-
45
-
46
-
47
-
48
-
49
-
50
-
51
-
52
-
53
-
54
-
55
-
56
-
57
-
58
-
59
-
60
-
61
-
62
-
63
-
64
-
65
-
66
-
67
-
68
-
69
-
70
-
71
-
72
-
73
-
74
-
75
-
76
-
77
-
78
-
79
-
80
-
81
-
 82
82 -
 83
83 -
 84
84 -
 85
85 -
 86
86 -
 87
87 -
 88
88 -
 89
89 -
 90
90 -
 91
91 -
 92
92 -
 93
93 -
 94
94 -
 95
95 -
 96
96 -
 97
97 -
 98
98 -
 99
99 -
 100
100 -
 101
101 -
 102
102 -
103
-
104
-
105
-
106
-
107
-
108
-
109
-
110
-
111
-
112
-
113
-
114
-
115
-
116
-
117
-
118
-
119
-
120
-
121
-
122
-
123
-
124
-
125
-
126
-
127
-
128
-
129
-
130
-
131
-
132
-
133
-
134
-
135
-
136
-
137
-
138
-
139
-
140
-
141
-
142
-
143
-
144
-
145
-
146
-
147
-
148
-
149
-
150
-
151
-
152
-
153
-
154
-
155
-
156
-
157
-
158
-
159
-
160
-
161
-
162
-
163
-
164
-
165
-
166
-
167
-
168
-
169
-
170
-
171
-
172
-
173
-
174
-
175
-
176
-
177
-
178
-
179
-
180
-
181
-
182
-
183
-
184
-
185
-
186
-
187
-
188
-
189
-
190
-
191
-
192
-
193
-
194
-
195
-
196
-
197
-
198
-
199
-
200
-
201
-
202
-
203
-
204
-
205
-
206
-
207
-
208
-
209
-
210
-
211
-
212
-
213
-
214
-
215
-
216
-
217
-
218
-
219
-
220
-
221
-
222
-
223
-
224
-
225
-
226
-
227
-
228
-
229
-
230
-
231
-
232
 |
 |

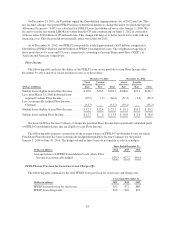
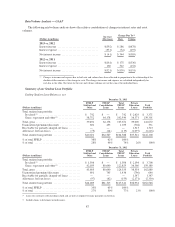
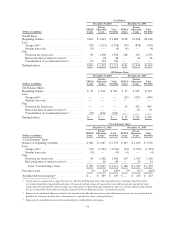
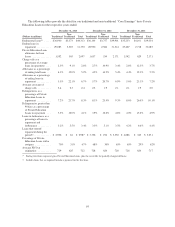
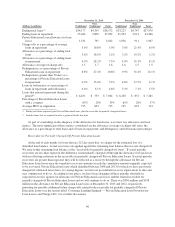
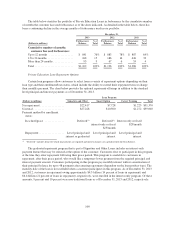
Student Loan Allowance for Loan Losses Activity
GAAP and “Core Earnings” Basis
December 31, 2013 December 31, 2012 December 31, 2011
(Dollars in millions)
FFELP
Loans
Private
Education
Loans
Total
Portfolio
FFELP
Loans
Private
Education
Loans
Total
Portfolio
FFELP
Loans
Private
Education
Loans
Total
Portfolio
GAAP Basis:
Beginning balance ............... $159 $2,171 $2,330 $187 $ 2,171 $ 2,358 $189 $ 2,022 $ 2,211
Less:
Charge-offs(1) ................. (78) (878) (956) (92) (1,037) (1,129) (78) (1,072) (1,150)
Student loan sales .............. (14) — (14) (8) — (8) (10) — (10)
Plus:
Provision for loan losses ......... 52 787 839 72 1,008 1,080 86 1,179 1,265
Reclassification of interest
reserve(2) ................... — 17 17 — 29 29 — 42 42
Ending balance .................. $119 $2,097 $2,216 $159 $ 2,171 $ 2,330 $187 $ 2,171 $ 2,358
Percent of total .................. 5% 95% 100% 7% 93% 100% 8% 92% 100%
Troubled debt restructuring(3) ....... — 8,949 8,949 — 7,294 7,294 — 5,249 5,249
(1) Charge-offs are reported net of expected recoveries. For Private Education Loans, the expected recovery amount is transferred to the
receivable for partially charged-off loan balance. Charge-offs include charge-offs against the receivable for partially charged-off loans
which represents the difference between what was expected to be collected and any shortfalls in what was actually collected in the period.
See “Receivable for Partially Charged-Off Private Education Loans” for further discussion.
(2) Represents the additional allowance related to the amount of uncollectible interest reserved within interest income that is transferred in the
period to the allowance for loan losses when interest is capitalized to a loan’s principal balance.
(3) Represents the recorded investment of loans classified as troubled debt restructuring.
90