Sallie Mae 2013 Annual Report Download - page 91
Download and view the complete annual report
Please find page 91 of the 2013 Sallie Mae annual report below. You can navigate through the pages in the report by either clicking on the pages listed below, or by using the keyword search tool below to find specific information within the annual report.-
 1
1 -
2
-
3
-
4
-
5
-
6
-
7
-
8
-
9
-
10
-
11
-
12
-
13
-
14
-
15
-
16
-
17
-
18
-
19
-
20
-
21
-
22
-
23
-
24
-
25
-
26
-
27
-
28
-
29
-
30
-
31
-
32
-
33
-
34
-
35
-
36
-
37
-
38
-
39
-
40
-
41
-
42
-
43
-
44
-
45
-
46
-
47
-
48
-
49
-
50
-
51
-
52
-
53
-
54
-
55
-
56
-
57
-
58
-
59
-
60
-
61
-
62
-
63
-
64
-
65
-
66
-
67
-
68
-
69
-
70
-
71
-
72
-
73
-
74
-
75
-
76
-
77
-
78
-
79
-
80
-
 81
81 -
 82
82 -
 83
83 -
 84
84 -
 85
85 -
 86
86 -
 87
87 -
 88
88 -
 89
89 -
 90
90 -
 91
91 -
 92
92 -
 93
93 -
 94
94 -
 95
95 -
 96
96 -
 97
97 -
 98
98 -
 99
99 -
 100
100 -
 101
101 -
102
-
103
-
104
-
105
-
106
-
107
-
108
-
109
-
110
-
111
-
112
-
113
-
114
-
115
-
116
-
117
-
118
-
119
-
120
-
121
-
122
-
123
-
124
-
125
-
126
-
127
-
128
-
129
-
130
-
131
-
132
-
133
-
134
-
135
-
136
-
137
-
138
-
139
-
140
-
141
-
142
-
143
-
144
-
145
-
146
-
147
-
148
-
149
-
150
-
151
-
152
-
153
-
154
-
155
-
156
-
157
-
158
-
159
-
160
-
161
-
162
-
163
-
164
-
165
-
166
-
167
-
168
-
169
-
170
-
171
-
172
-
173
-
174
-
175
-
176
-
177
-
178
-
179
-
180
-
181
-
182
-
183
-
184
-
185
-
186
-
187
-
188
-
189
-
190
-
191
-
192
-
193
-
194
-
195
-
196
-
197
-
198
-
199
-
200
-
201
-
202
-
203
-
204
-
205
-
206
-
207
-
208
-
209
-
210
-
211
-
212
-
213
-
214
-
215
-
216
-
217
-
218
-
219
-
220
-
221
-
222
-
223
-
224
-
225
-
226
-
227
-
228
-
229
-
230
-
231
-
232
 |
 |

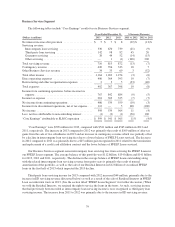
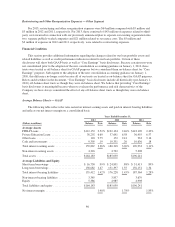
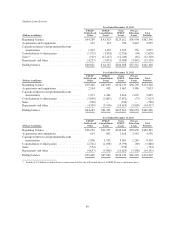
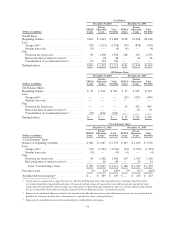
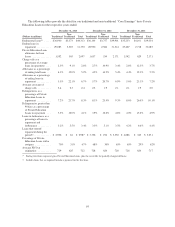
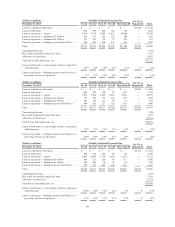
Student Loan Activity
Year Ended December 31, 2013
(Dollars in millions)
FFELP
Stafford and
Other
FFELP
Consolidation
Loans
Total
FFELP
Loans
Private
Education
Loans
Total
Portfolio
Beginning balance .......................... $44,289 $ 81,323 $125,612 $36,934 $162,546
Acquisitions and originations ................. 413 323 736 3,819 4,555
Capitalized interest and premium/discount
amortization ............................ 1,203 1,120 2,323 756 3,079
Consolidations to third parties ................ (1,525) (1,001) (2,526) (94) (2,620)
Sales(1) ................................... (102) (12,147) (12,249) (61) (12,310)
Repayments and other ....................... (4,257) (5,051) (9,308) (3,842) (13,150)
Ending balance ............................ $40,021 $ 64,567 $104,588 $37,512 $142,100
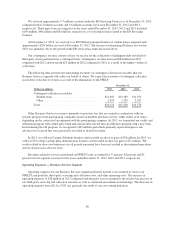
Year Ended December 31, 2012
(Dollars in millions)
FFELP
Stafford and
Other
FFELP
Consolidation
Loans
Total
FFELP
Loans
Private
Education
Loans
Total
Portfolio
Beginning balance .......................... $50,440 $87,690 $138,130 $36,290 $174,420
Acquisitions and originations ................. 2,764 903 3,667 3,386 7,053
Capitalized interest and premium/discount
amortization ............................ 1,373 1,443 2,816 1,029 3,845
Consolidations to third parties ................ (5,049) (2,803) (7,852) (73) (7,925)
Sales .................................... (530) — (530) — (530)
Repayments and other ....................... (4,709) (5,910) (10,619) (3,698) (14,317)
Ending balance ............................ $44,289 $81,323 $125,612 $36,934 $162,546
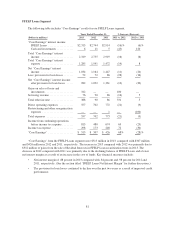
Year Ended December 31, 2011
(Dollars in millions)
FFELP
Stafford and
Other
FFELP
Consolidation
Loans
Total
FFELP
Loans
Private
Education
Loans
Total
Portfolio
Beginning balance .......................... $56,252 $92,397 $148,649 $35,656 $184,305
Acquisitions and originations ................. 814 802 1,616 2,942 4,558
Capitalized interest and premium/discount
amortization ............................ 1,506 1,535 3,041 1,269 4,310
Consolidations to third parties ................ (2,741) (1,058) (3,799) (69) (3,868)
Sales .................................... (754) — (754) — (754)
Repayments and other ....................... (4,637) (5,986) (10,623) (3,508) (14,131)
Ending balance ............................ $50,440 $87,690 $138,130 $36,290 $174,420
(1) Includes $12.0 billion of student loans in connection with the sale of Residual Interests in FFELP Loan securitization trusts.
89