Sallie Mae 2013 Annual Report Download - page 214
Download and view the complete annual report
Please find page 214 of the 2013 Sallie Mae annual report below. You can navigate through the pages in the report by either clicking on the pages listed below, or by using the keyword search tool below to find specific information within the annual report.-
 1
1 -
2
-
3
-
4
-
5
-
6
-
7
-
8
-
9
-
10
-
11
-
12
-
13
-
14
-
15
-
16
-
17
-
18
-
19
-
20
-
21
-
22
-
23
-
24
-
25
-
26
-
27
-
28
-
29
-
30
-
31
-
32
-
33
-
34
-
35
-
36
-
37
-
38
-
39
-
40
-
41
-
42
-
43
-
44
-
45
-
46
-
47
-
48
-
49
-
50
-
51
-
52
-
53
-
54
-
55
-
56
-
57
-
58
-
59
-
60
-
61
-
62
-
63
-
64
-
65
-
66
-
67
-
68
-
69
-
70
-
71
-
72
-
73
-
74
-
75
-
76
-
77
-
78
-
79
-
80
-
81
-
82
-
83
-
84
-
85
-
86
-
87
-
88
-
89
-
90
-
91
-
92
-
93
-
94
-
95
-
96
-
97
-
98
-
99
-
100
-
101
-
102
-
103
-
104
-
105
-
106
-
107
-
108
-
109
-
110
-
111
-
112
-
113
-
114
-
115
-
116
-
117
-
118
-
119
-
120
-
121
-
122
-
123
-
124
-
125
-
126
-
127
-
128
-
129
-
130
-
131
-
132
-
133
-
134
-
135
-
136
-
137
-
138
-
139
-
140
-
141
-
142
-
143
-
144
-
145
-
146
-
147
-
148
-
149
-
150
-
151
-
152
-
153
-
154
-
155
-
156
-
157
-
158
-
159
-
160
-
161
-
162
-
163
-
164
-
165
-
166
-
167
-
168
-
169
-
170
-
171
-
172
-
173
-
174
-
175
-
176
-
177
-
178
-
179
-
180
-
181
-
182
-
183
-
184
-
185
-
186
-
187
-
188
-
189
-
190
-
191
-
192
-
193
-
194
-
195
-
196
-
197
-
198
-
199
-
200
-
201
-
202
-
203
-
 204
204 -
 205
205 -
 206
206 -
 207
207 -
 208
208 -
 209
209 -
 210
210 -
 211
211 -
 212
212 -
 213
213 -
 214
214 -
 215
215 -
 216
216 -
 217
217 -
 218
218 -
 219
219 -
 220
220 -
 221
221 -
 222
222 -
 223
223 -
 224
224 -
225
-
226
-
227
-
228
-
229
-
230
-
231
-
232
 |
 |

SLM CORPORATION
NOTES TO CONSOLIDATED FINANCIAL STATEMENTS (Continued)
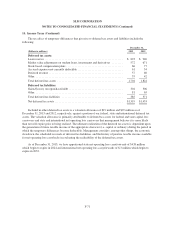
15. Segment Reporting (Continued)
Our FFELP Loan portfolio will amortize over approximately 20 years. Our goal is to maximize the cash
flow generated by the portfolio. We will seek to acquire other third-party FFELP Loan portfolios to add net
interest income and servicing revenue.
HEA continues to regulate every aspect of the FFELP, including ongoing communications with borrowers
and default aversion requirements. Failure to service a FFELP Loan properly could jeopardize the insurance and
guarantees and federal support on these loans. The insurance and guarantees on our existing loans were not
affected by the July 2010 termination of the FFELP program.
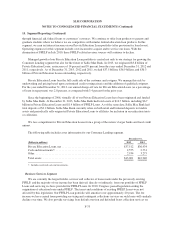
The following table includes asset information for our FFELP Loans segment.
December 31,
(Dollars in millions) 2013 2012
FFELP Loans, net ............................................... $104,588 $125,612
Cash and investments(1) ........................................... 4,473 5,766
Other ......................................................... 3,587 4,286
Total assets .................................................... $112,648 $135,664
(1) Includes restricted cash and investments.
Other Segment
The Other segment consists primarily of the financial results related to activities of our holding company,
including the repurchase of debt, the corporate liquidity portfolio and all overhead. We also include results from
certain, smaller wind-down and discontinued operations within this segment. Overhead expenses include costs
related to executive management, the Board of Directors, accounting, finance, legal, human resources, stock-
based compensation expense and certain information technology costs related to infrastructure and operations.
At December 31, 2013 and 2012, the Other segment had total assets of $3.0 billion and $1.8 billion,
respectively.
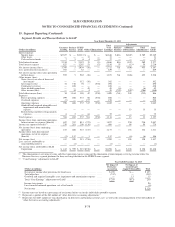
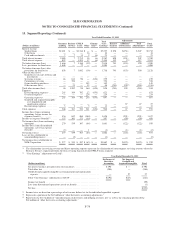
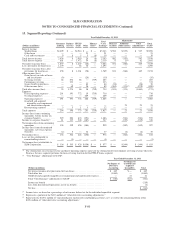
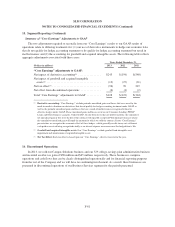
Measure of Profitability
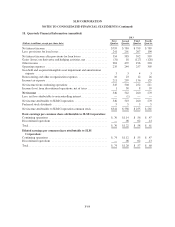
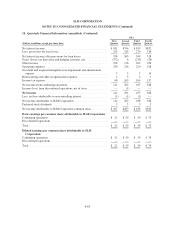
The tables below include the condensed operating results for each of our reportable segments. Management,
including the chief operating decision makers, evaluates the Company on certain performance measures that we
refer to as “Core Earnings” performance measures for each operating segment. We use “Core Earnings” to
manage each business segment because “Core Earnings” reflect adjustments to GAAP financial results for two
items, discussed below, that create significant volatility mostly due to timing factors generally beyond the control
of management. Accordingly, we believe that “Core Earnings” provide management with a useful basis from
which to better evaluate results from ongoing operations against the business plan or against results from prior
periods. Consequently, we disclose this information as we believe it provides investors with additional
information regarding the operational and performance indicators that are most closely assessed by management.
The two items adjusted for in our “Core Earnings” presentations are (1) our use of derivative instruments to
hedge our economic risks that do not qualify for hedge accounting treatment or do qualify for hedge accounting
treatment but result in ineffectiveness and (2) the accounting for goodwill and acquired intangible assets. The
tables presented below reflect “Core Earnings” operating measures reviewed and utilized by management to
manage the business. Reconciliation of the “Core Earnings” segment totals to our consolidated operating results
in accordance with GAAP is also included in the tables below.
F-76