Sallie Mae 2013 Annual Report Download - page 36
Download and view the complete annual report
Please find page 36 of the 2013 Sallie Mae annual report below. You can navigate through the pages in the report by either clicking on the pages listed below, or by using the keyword search tool below to find specific information within the annual report.-
 1
1 -
2
-
3
-
4
-
5
-
6
-
7
-
8
-
9
-
10
-
11
-
12
-
13
-
14
-
15
-
16
-
17
-
18
-
19
-
20
-
21
-
22
-
23
-
24
-
25
-
 26
26 -
 27
27 -
 28
28 -
 29
29 -
 30
30 -
 31
31 -
 32
32 -
 33
33 -
 34
34 -
 35
35 -
 36
36 -
 37
37 -
 38
38 -
 39
39 -
 40
40 -
 41
41 -
 42
42 -
 43
43 -
 44
44 -
 45
45 -
 46
46 -
47
-
48
-
49
-
50
-
51
-
52
-
53
-
54
-
55
-
56
-
57
-
58
-
59
-
60
-
61
-
62
-
63
-
64
-
65
-
66
-
67
-
68
-
69
-
70
-
71
-
72
-
73
-
74
-
75
-
76
-
77
-
78
-
79
-
80
-
81
-
82
-
83
-
84
-
85
-
86
-
87
-
88
-
89
-
90
-
91
-
92
-
93
-
94
-
95
-
96
-
97
-
98
-
99
-
100
-
101
-
102
-
103
-
104
-
105
-
106
-
107
-
108
-
109
-
110
-
111
-
112
-
113
-
114
-
115
-
116
-
117
-
118
-
119
-
120
-
121
-
122
-
123
-
124
-
125
-
126
-
127
-
128
-
129
-
130
-
131
-
132
-
133
-
134
-
135
-
136
-
137
-
138
-
139
-
140
-
141
-
142
-
143
-
144
-
145
-
146
-
147
-
148
-
149
-
150
-
151
-
152
-
153
-
154
-
155
-
156
-
157
-
158
-
159
-
160
-
161
-
162
-
163
-
164
-
165
-
166
-
167
-
168
-
169
-
170
-
171
-
172
-
173
-
174
-
175
-
176
-
177
-
178
-
179
-
180
-
181
-
182
-
183
-
184
-
185
-
186
-
187
-
188
-
189
-
190
-
191
-
192
-
193
-
194
-
195
-
196
-
197
-
198
-
199
-
200
-
201
-
202
-
203
-
204
-
205
-
206
-
207
-
208
-
209
-
210
-
211
-
212
-
213
-
214
-
215
-
216
-
217
-
218
-
219
-
220
-
221
-
222
-
223
-
224
-
225
-
226
-
227
-
228
-
229
-
230
-
231
-
232
 |
 |

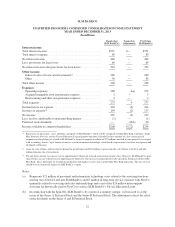
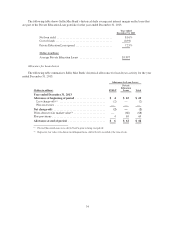
The following table shows Sallie Mae Bank’s historical daily average net interest margin on the loans that
are part of the Private Education Loan portfolio for the year ended December 31, 2013.
Year ended
December 31, 2013
Net loan yield ....................................... 8.16%
Cost of funds ........................................ (0.93)
Private Education Loan spread .......................... 7.23%
(Dollars in millions)
Average Private Education Loans ....................... $5,997
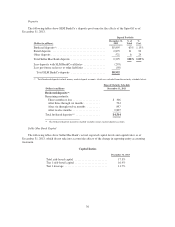
Allowance for Loan Losses
The following table summarizes Sallie Mae Bank’s historical allowance for loan losses activity for the year
ended December 31, 2013.
Allowance for Loan Losses
(Dollars in millions) FFELP
Private
Education
Loans Total
Year ended December 31, 2013
Allowance at beginning of period ..................... $4 $65 $69
Less charge-offs(1) ................................ (2) — (2)
Plus recoveries ................................... — — —
Net charge-offs .................................... (2) — (2)
Write-down to fair market value(2) ...................... — (68) (68)
Plus provisions ..................................... 4 65 69
Allowance at end of period .......................... $6 $62 $68
(1) Private Education Loans were sold to NewCo prior to being charged off.
(2) Represents fair value write-downs on delinquent loans sold to NewCo recorded at the time of sale.
34