Sallie Mae 2013 Annual Report Download - page 67
Download and view the complete annual report
Please find page 67 of the 2013 Sallie Mae annual report below. You can navigate through the pages in the report by either clicking on the pages listed below, or by using the keyword search tool below to find specific information within the annual report.-
 1
1 -
2
-
3
-
4
-
5
-
6
-
7
-
8
-
9
-
10
-
11
-
12
-
13
-
14
-
15
-
16
-
17
-
18
-
19
-
20
-
21
-
22
-
23
-
24
-
25
-
26
-
27
-
28
-
29
-
30
-
31
-
32
-
33
-
34
-
35
-
36
-
37
-
38
-
39
-
40
-
41
-
42
-
43
-
44
-
45
-
46
-
47
-
48
-
49
-
50
-
51
-
52
-
53
-
54
-
55
-
56
-
 57
57 -
 58
58 -
 59
59 -
 60
60 -
 61
61 -
 62
62 -
 63
63 -
 64
64 -
 65
65 -
 66
66 -
 67
67 -
 68
68 -
 69
69 -
 70
70 -
 71
71 -
 72
72 -
 73
73 -
 74
74 -
 75
75 -
 76
76 -
 77
77 -
78
-
79
-
80
-
81
-
82
-
83
-
84
-
85
-
86
-
87
-
88
-
89
-
90
-
91
-
92
-
93
-
94
-
95
-
96
-
97
-
98
-
99
-
100
-
101
-
102
-
103
-
104
-
105
-
106
-
107
-
108
-
109
-
110
-
111
-
112
-
113
-
114
-
115
-
116
-
117
-
118
-
119
-
120
-
121
-
122
-
123
-
124
-
125
-
126
-
127
-
128
-
129
-
130
-
131
-
132
-
133
-
134
-
135
-
136
-
137
-
138
-
139
-
140
-
141
-
142
-
143
-
144
-
145
-
146
-
147
-
148
-
149
-
150
-
151
-
152
-
153
-
154
-
155
-
156
-
157
-
158
-
159
-
160
-
161
-
162
-
163
-
164
-
165
-
166
-
167
-
168
-
169
-
170
-
171
-
172
-
173
-
174
-
175
-
176
-
177
-
178
-
179
-
180
-
181
-
182
-
183
-
184
-
185
-
186
-
187
-
188
-
189
-
190
-
191
-
192
-
193
-
194
-
195
-
196
-
197
-
198
-
199
-
200
-
201
-
202
-
203
-
204
-
205
-
206
-
207
-
208
-
209
-
210
-
211
-
212
-
213
-
214
-
215
-
216
-
217
-
218
-
219
-
220
-
221
-
222
-
223
-
224
-
225
-
226
-
227
-
228
-
229
-
230
-
231
-
232
 |
 |

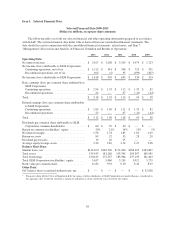
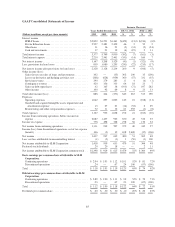
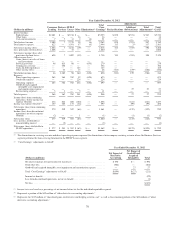
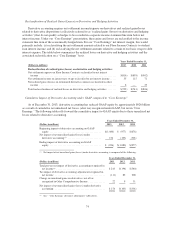
GAAP Consolidated Statements of Income
Increase (Decrease)
Years Ended December 31, 2013 vs. 2012 2012 vs. 2011
(Dollars in millions, except per share amounts) 2013 2012 2011 $ % $ %
Interest income
FFELP Loans ..................................... $2,822 $3,251 $3,461 $(429) (13)% $(210) (6)%
Private Education Loans ............................. 2,527 2,481 2,429 46 2 52 2
Other loans ....................................... 11 16 21 (5) (31) (5) (24)
Cash and investments ............................... 17 21 19 (4) (19) 2 11
Total interest income ................................. 5,377 5,769 5,930 (392) (7) (161) (3)
Total interest expense ................................. 2,210 2,561 2,401 (351) (14) 160 7
Net interest income ................................... 3,167 3,208 3,529 (41) (1) (321) (9)
Less: provisions for loan losses ......................... 839 1,080 1,295 (241) (22) (215) (17)
Net interest income after provisions for loan losses ......... 2,328 2,128 2,234 200 9 (106) (5)
Other income (loss):
Gains (losses) on sales of loans and investments .......... 302 — (35) 302 100 35 (100)
Losses on derivative and hedging activities, net .......... (268) (628) (959) 360 (57) 331 (35)
Servicing revenue .................................. 290 279 283 11 4 (4) (1)
Contingency revenue ............................... 420 356 333 64 18 23 7
Gains on debt repurchases ........................... 42 145 38 (103) (71) 107 282
Other income ..................................... 100 92 69 8 9 23 33
Total other income (loss) .............................. 886 244 (271) 642 263 515 190
Expenses:
Operating expenses ................................ 1,042 897 1,005 145 16 (108) (11)
Goodwill and acquired intangible assets impairment and
amortization expense ............................. 13 27 21 (14) (52) 6 29
Restructuring and other reorganization expenses .......... 72 11 12 61 555 (1) (8)
Total expenses ...................................... 1,127 935 1,038 192 21 (103) (10)
Income from continuing operations, before income tax
expense .......................................... 2,087 1,437 925 650 45 512 55
Income tax expense .................................. 776 498 328 278 56 170 52
Net income from continuing operations ................... 1,311 939 597 372 40 342 57
Income (loss) from discontinued operations, net of tax expense
(benefit) ......................................... 106 (2) 35 108 5,400 (37) (106)
Net income ......................................... 1,417 937 632 480 51 305 48
Less: net loss attributable to noncontrolling interest ......... (1) (2) (1) 1 (50) (1) 100
Net income attributable to SLM Corporation .............. 1,418 939 633 479 51 306 48
Preferred stock dividends .............................. 20 20 18 — — 2 11
Net income attributable to SLM Corporation common stock . . $1,398 $ 919 $ 615 $ 479 52% $ 304 49%
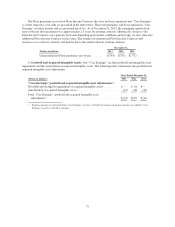
Basic earnings per common share attributable to SLM
Corporation:
Continuing operations .............................. $ 2.94 $ 1.93 $ 1.12 $1.01 52% $ .81 72%
Discontinued operations ............................. .24 — .07 .24 100 (.07) (100)
Total .............................................. $ 3.18 $ 1.93 $ 1.19 $1.25 65% $ .74 62%
Diluted earnings per common share attributable to SLM
Corporation:
Continuing operations .............................. $ 2.89 $ 1.90 $ 1.11 $ .99 52% $ .79 71%
Discontinued operations ............................. .23 — .07 .23 100 (.07) (100)
Total .............................................. $ 3.12 $ 1.90 $ 1.18 $1.22 64% $ .72 61%
Dividends per common share ........................... $ .60 $ .50 $ .30 $ .10 20% $ .20 67%
65