Sallie Mae 2013 Annual Report Download - page 79
Download and view the complete annual report
Please find page 79 of the 2013 Sallie Mae annual report below. You can navigate through the pages in the report by either clicking on the pages listed below, or by using the keyword search tool below to find specific information within the annual report.-
 1
1 -
2
-
3
-
4
-
5
-
6
-
7
-
8
-
9
-
10
-
11
-
12
-
13
-
14
-
15
-
16
-
17
-
18
-
19
-
20
-
21
-
22
-
23
-
24
-
25
-
26
-
27
-
28
-
29
-
30
-
31
-
32
-
33
-
34
-
35
-
36
-
37
-
38
-
39
-
40
-
41
-
42
-
43
-
44
-
45
-
46
-
47
-
48
-
49
-
50
-
51
-
52
-
53
-
54
-
55
-
56
-
57
-
58
-
59
-
60
-
61
-
62
-
63
-
64
-
65
-
66
-
67
-
68
-
 69
69 -
 70
70 -
 71
71 -
 72
72 -
 73
73 -
 74
74 -
 75
75 -
 76
76 -
 77
77 -
 78
78 -
 79
79 -
 80
80 -
 81
81 -
 82
82 -
 83
83 -
 84
84 -
 85
85 -
 86
86 -
 87
87 -
 88
88 -
 89
89 -
90
-
91
-
92
-
93
-
94
-
95
-
96
-
97
-
98
-
99
-
100
-
101
-
102
-
103
-
104
-
105
-
106
-
107
-
108
-
109
-
110
-
111
-
112
-
113
-
114
-
115
-
116
-
117
-
118
-
119
-
120
-
121
-
122
-
123
-
124
-
125
-
126
-
127
-
128
-
129
-
130
-
131
-
132
-
133
-
134
-
135
-
136
-
137
-
138
-
139
-
140
-
141
-
142
-
143
-
144
-
145
-
146
-
147
-
148
-
149
-
150
-
151
-
152
-
153
-
154
-
155
-
156
-
157
-
158
-
159
-
160
-
161
-
162
-
163
-
164
-
165
-
166
-
167
-
168
-
169
-
170
-
171
-
172
-
173
-
174
-
175
-
176
-
177
-
178
-
179
-
180
-
181
-
182
-
183
-
184
-
185
-
186
-
187
-
188
-
189
-
190
-
191
-
192
-
193
-
194
-
195
-
196
-
197
-
198
-
199
-
200
-
201
-
202
-
203
-
204
-
205
-
206
-
207
-
208
-
209
-
210
-
211
-
212
-
213
-
214
-
215
-
216
-
217
-
218
-
219
-
220
-
221
-
222
-
223
-
224
-
225
-
226
-
227
-
228
-
229
-
230
-
231
-
232
 |
 |

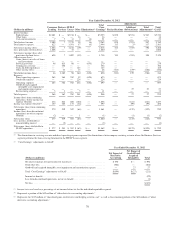
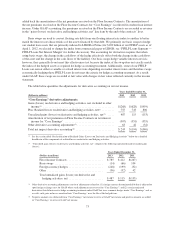
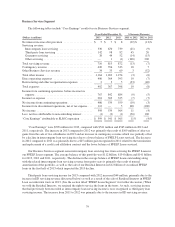
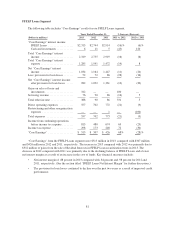
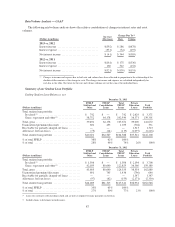
Consumer Lending Net Interest Margin
The following table shows the Consumer Lending “Core Earnings” net interest margin along with
reconciliation to the GAAP-basis Consumer Lending net interest margin before provision for loan losses.
Years Ended December 31,
2013 2012 2011
“Core Earnings” basis Private Education Loan yield ................ 6.39% 6.36% 6.34%
Discount amortization ........................................ .21 .22 .23
“Core Earnings” basis Private Education Loan net yield ............. 6.60 6.58 6.57
“Core Earnings” basis Private Education Loan cost of funds .......... (2.03) (2.04) (1.99)
“Core Earnings” basis Private Education Loan spread ............... 4.57 4.54 4.58
“Core Earnings” basis other asset spread impact .................... (.41) (.41) (.49)
“Core Earnings” basis Consumer Lending net interest margin(1) ....... 4.16% 4.13% 4.09%
“Core Earnings” basis Consumer Lending net interest margin(1) ....... 4.16% 4.13% 4.09%
Adjustment for GAAP accounting treatment(2) ..................... (.03) (.10) (.08)
GAAP-basis Consumer Lending net interest margin(1) ............... 4.13% 4.03% 4.01%
(1) The average balances of our Consumer Lending “Core Earnings” basis interest-earning assets for the respective periods are:
Years Ended December 31,
(Dollars in millions) 2013 2012 2011
Private Education Loans ................................................ $38,292 $37,691 $36,955
Other interest-earning assets ............................................. 2,727 2,572 3,015
Total Consumer Lending “Core Earnings” basis interest-earning assets ........... $41,019 $40,263 $39,970
(2) Represents the reclassification of periodic interest accruals on derivative contracts from net interest income to other income and
other derivative accounting adjustments. For further discussion of these adjustments, see the section titled “‘Core Earnings’ —
Definition and Limitations — Differences between ‘Core Earnings’ and GAAP.”
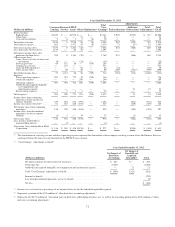
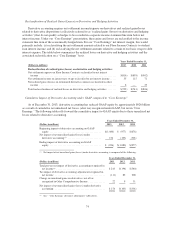
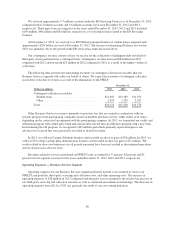
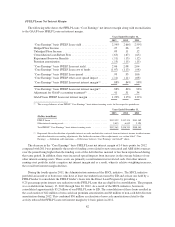
Private Education Loans Provision for Loan Losses and Charge-Offs
The following table summarizes the total Private Education Loans provision for loan losses and charge-offs.
Years Ended December 31,
(Dollars in millions) 2013 2012 2011
Private Education Loan provision for loan losses .................... $787 $1,008 $1,179
Private Education Loan charge-offs .............................. $878 $1,037 $1,072
In establishing the allowance for Private Education Loan losses as of December 31, 2013, we considered
several factors with respect to our Private Education Loan portfolio. In particular, we continue to see
improvement in credit quality and continuing positive delinquency, forbearance and charge-off trends in
connection with this portfolio. Improving credit quality is seen in higher FICO scores and cosigner rates as well
as a more seasoned portfolio. Total loans delinquent (as a percentage of loans in repayment) have decreased to
8.3 percent from 9.3 percent in the year-ago period. Loans greater than 90 days delinquent (as a percentage of
loans in repayment) have decreased to 4.1 percent from 4.6 percent in the prior year. The charge-off rate
decreased to 2.8 percent from 3.4 percent in the prior year. Loans in forbearance (as a percentage of loans in
repayment and forbearance) decreased to 3.4 percent from 3.5 percent in the prior year.
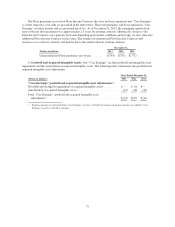
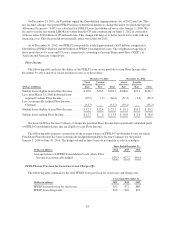
Apart from the overall improvements discussed above that had the effect of reducing the provision for loan
losses in 2013 compared to prior years, Private Education Loans that have defaulted between 2008 and 2013 for
77