Sallie Mae 2013 Annual Report Download - page 83
Download and view the complete annual report
Please find page 83 of the 2013 Sallie Mae annual report below. You can navigate through the pages in the report by either clicking on the pages listed below, or by using the keyword search tool below to find specific information within the annual report.-
 1
1 -
2
-
3
-
4
-
5
-
6
-
7
-
8
-
9
-
10
-
11
-
12
-
13
-
14
-
15
-
16
-
17
-
18
-
19
-
20
-
21
-
22
-
23
-
24
-
25
-
26
-
27
-
28
-
29
-
30
-
31
-
32
-
33
-
34
-
35
-
36
-
37
-
38
-
39
-
40
-
41
-
42
-
43
-
44
-
45
-
46
-
47
-
48
-
49
-
50
-
51
-
52
-
53
-
54
-
55
-
56
-
57
-
58
-
59
-
60
-
61
-
62
-
63
-
64
-
65
-
66
-
67
-
68
-
69
-
70
-
71
-
72
-
 73
73 -
 74
74 -
 75
75 -
 76
76 -
 77
77 -
 78
78 -
 79
79 -
 80
80 -
 81
81 -
 82
82 -
 83
83 -
 84
84 -
 85
85 -
 86
86 -
 87
87 -
 88
88 -
 89
89 -
 90
90 -
 91
91 -
 92
92 -
 93
93 -
94
-
95
-
96
-
97
-
98
-
99
-
100
-
101
-
102
-
103
-
104
-
105
-
106
-
107
-
108
-
109
-
110
-
111
-
112
-
113
-
114
-
115
-
116
-
117
-
118
-
119
-
120
-
121
-
122
-
123
-
124
-
125
-
126
-
127
-
128
-
129
-
130
-
131
-
132
-
133
-
134
-
135
-
136
-
137
-
138
-
139
-
140
-
141
-
142
-
143
-
144
-
145
-
146
-
147
-
148
-
149
-
150
-
151
-
152
-
153
-
154
-
155
-
156
-
157
-
158
-
159
-
160
-
161
-
162
-
163
-
164
-
165
-
166
-
167
-
168
-
169
-
170
-
171
-
172
-
173
-
174
-
175
-
176
-
177
-
178
-
179
-
180
-
181
-
182
-
183
-
184
-
185
-
186
-
187
-
188
-
189
-
190
-
191
-
192
-
193
-
194
-
195
-
196
-
197
-
198
-
199
-
200
-
201
-
202
-
203
-
204
-
205
-
206
-
207
-
208
-
209
-
210
-
211
-
212
-
213
-
214
-
215
-
216
-
217
-
218
-
219
-
220
-
221
-
222
-
223
-
224
-
225
-
226
-
227
-
228
-
229
-
230
-
231
-
232
 |
 |

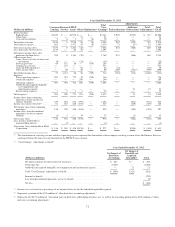
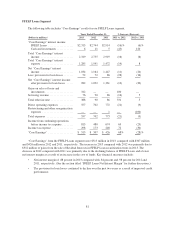
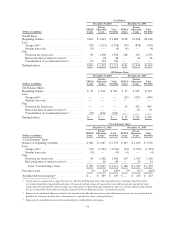
FFELP Loans Segment
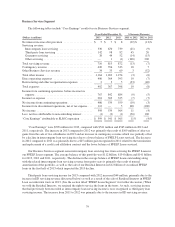
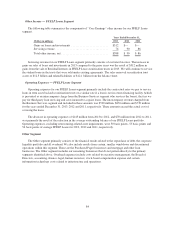
The following table includes “Core Earnings” results for our FFELP Loans segment.
Years Ended December 31, % Increase (Decrease)
(Dollars in millions) 2013 2012 2011 2013 vs. 2012 2012 vs. 2011
“Core Earnings” interest income:
FFELP Loans .................. $2,313 $2,744 $2,914 (16)% (6)%
Cash and investments ............ 6 11 5 (45) 120
Total “Core Earnings” interest
income ....................... 2,319 2,755 2,919 (16) (6)
Total “Core Earnings” interest
expense ....................... 1,285 1,591 1,472 (19) 8
Net “Core Earnings” interest
income ....................... 1,034 1,164 1,447 (11) (20)
Less: provision for loan losses ....... 52 72 86 (28) (16)
Net “Core Earnings” interest income
after provision for loan losses ..... 982 1,092 1,361 (10) (20)
Gains on sales of loans and
investments .................... 312 — — 100 —
Servicing revenue ................. 76 90 86 (16) 5
Total other income ................ 388 90 86 331 5
Direct operating expenses .......... 557 702 772 (21) (9)
Restructuring and other reorganization
expenses ...................... — — 1 — (100)
Total expenses ................... 557 702 773 (21) (9)
Income from continuing operations,
before income tax expense ........ 813 480 674 69 (29)
Income tax expense ............... 298 173 248 72 (30)
“Core Earnings” .................. $ 515 $ 307 $ 426 68% (28)%
“Core Earnings” from the FFELP Loans segment were $515 million in 2013, compared with $307 million
and $426 million in 2012 and 2011, respectively. The increase in 2013 compared with 2012 was primarily due to
$312 million of gains from the sale of Residual Interests in FFELP Loan securitization trusts in 2013. The
decrease in 2012 compared with 2011 was primarily due to the declining balance of FFELP Loans and a lower
net interest margin as a result of an increase in the cost of funds. Key financial measures include:
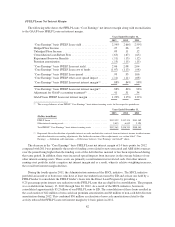
• Net interest margin of .88 percent in 2013 compared with .84 percent and .98 percent for 2012 and
2011, respectively. (See the section titled “FFELP Loans Net Interest Margin” for further discussion.)
• The provision for loan losses continued to decline over the past two years as a result of improved credit
performance.
81