Sallie Mae 2013 Annual Report Download - page 156
Download and view the complete annual report
Please find page 156 of the 2013 Sallie Mae annual report below. You can navigate through the pages in the report by either clicking on the pages listed below, or by using the keyword search tool below to find specific information within the annual report.-
 1
1 -
2
-
3
-
4
-
5
-
6
-
7
-
8
-
9
-
10
-
11
-
12
-
13
-
14
-
15
-
16
-
17
-
18
-
19
-
20
-
21
-
22
-
23
-
24
-
25
-
26
-
27
-
28
-
29
-
30
-
31
-
32
-
33
-
34
-
35
-
36
-
37
-
38
-
39
-
40
-
41
-
42
-
43
-
44
-
45
-
46
-
47
-
48
-
49
-
50
-
51
-
52
-
53
-
54
-
55
-
56
-
57
-
58
-
59
-
60
-
61
-
62
-
63
-
64
-
65
-
66
-
67
-
68
-
69
-
70
-
71
-
72
-
73
-
74
-
75
-
76
-
77
-
78
-
79
-
80
-
81
-
82
-
83
-
84
-
85
-
86
-
87
-
88
-
89
-
90
-
91
-
92
-
93
-
94
-
95
-
96
-
97
-
98
-
99
-
100
-
101
-
102
-
103
-
104
-
105
-
106
-
107
-
108
-
109
-
110
-
111
-
112
-
113
-
114
-
115
-
116
-
117
-
118
-
119
-
120
-
121
-
122
-
123
-
124
-
125
-
126
-
127
-
128
-
129
-
130
-
131
-
132
-
133
-
134
-
135
-
136
-
137
-
138
-
139
-
140
-
141
-
142
-
143
-
144
-
145
-
 146
146 -
 147
147 -
 148
148 -
 149
149 -
 150
150 -
 151
151 -
 152
152 -
 153
153 -
 154
154 -
 155
155 -
 156
156 -
 157
157 -
 158
158 -
 159
159 -
 160
160 -
 161
161 -
 162
162 -
 163
163 -
 164
164 -
 165
165 -
 166
166 -
167
-
168
-
169
-
170
-
171
-
172
-
173
-
174
-
175
-
176
-
177
-
178
-
179
-
180
-
181
-
182
-
183
-
184
-
185
-
186
-
187
-
188
-
189
-
190
-
191
-
192
-
193
-
194
-
195
-
196
-
197
-
198
-
199
-
200
-
201
-
202
-
203
-
204
-
205
-
206
-
207
-
208
-
209
-
210
-
211
-
212
-
213
-
214
-
215
-
216
-
217
-
218
-
219
-
220
-
221
-
222
-
223
-
224
-
225
-
226
-
227
-
228
-
229
-
230
-
231
-
232
 |
 |
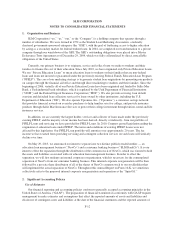
SLM CORPORATION
NOTES TO CONSOLIDATED FINANCIAL STATEMENTS (Continued)
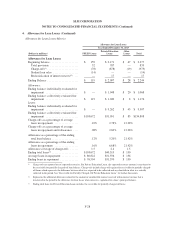
2. Significant Accounting Policies (Continued)
applied against the remaining loan balance that was not charged off. We refer to this remaining loan balance as
the “receivable for partially charged-off loans.” If actual periodic recoveries are less than expected, the difference
is immediately charged off through the allowance for loan losses with an offsetting reduction in the receivable
for partially charged-off Private Education Loans. If actual periodic recoveries are greater than expected, they
will be reflected as a recovery through the allowance for Private Education Loan losses once the cumulative
recovery amount exceeds the cumulative amount originally expected to be recovered. Private Education Loans
which defaulted between 2008 and 2013 for which we have previously charged off estimated losses have, to
varying degrees, not met our post-default recovery expectations to date and may continue not to do so. According
to our policy, we have been charging off these periodic shortfalls in expected recoveries against our allowance
for Private Education Loan losses and the related receivable for partially charged-off Private Education Loans
and we will continue to do so.
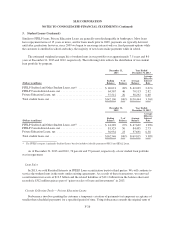
Allowance for FFELP Loan Losses
FFELP Loans are insured as to their principal and accrued interest in the event of default subject to a Risk
Sharing level based on the date of loan disbursement. These insurance obligations are supported by contractual
rights against the United States. For loans disbursed after October 1, 1993, and before July 1, 2006, we receive
98 percent reimbursement on all qualifying default claims. For loans disbursed on or after July 1, 2006, we
receive 97 percent reimbursement. For loans disbursed prior to October 1, 1993, we receive 100 percent
reimbursement.
Similar to the allowance for Private Education Loan losses, the allowance for FFELP Loan losses uses
historical experience of customer default behavior and a two-year loss confirmation period to estimate the credit
losses incurred in the loan portfolio at the reporting date. We apply the default rate projections, net of applicable
Risk Sharing, to each category for the current period to perform our quantitative calculation. Once the
quantitative calculation is performed, we review the adequacy of the allowance for loan losses and determine if
qualitative adjustments need to be considered.
Cash and Cash Equivalents
Cash and cash equivalents includes term federal funds, Eurodollar deposits, commercial paper, asset-backed
commercial paper, treasuries, money market funds and bank deposits with original terms to maturity of less than
three months.
Restricted Cash and Investments
Restricted cash primarily includes amounts held in student loan securitization trusts and other secured
borrowings. This cash must be used to make payments related to trust obligations. Amounts on deposit in these
accounts are primarily the result of timing differences between when principal and interest is collected on the
trust assets and when principal and interest is paid on trust liabilities.
Securities pledged as collateral related to our derivative portfolio, where the counterparty has rights to
replace the securities, are classified as restricted. When the counterparty does not have these rights, the security is
recorded in investments and disclosed as pledged collateral in the notes. Additionally, certain counterparties
require cash collateral pledged to us to be segregated and held in restricted cash accounts.
Investments
Our available-for-sale investment portfolio consists of investments that are AAA equivalent securities and are
carried at fair value, with the temporary changes in fair value carried as a separate component of stockholders’
F-18