Sallie Mae 2013 Annual Report Download - page 209
Download and view the complete annual report
Please find page 209 of the 2013 Sallie Mae annual report below. You can navigate through the pages in the report by either clicking on the pages listed below, or by using the keyword search tool below to find specific information within the annual report.-
 1
1 -
2
-
3
-
4
-
5
-
6
-
7
-
8
-
9
-
10
-
11
-
12
-
13
-
14
-
15
-
16
-
17
-
18
-
19
-
20
-
21
-
22
-
23
-
24
-
25
-
26
-
27
-
28
-
29
-
30
-
31
-
32
-
33
-
34
-
35
-
36
-
37
-
38
-
39
-
40
-
41
-
42
-
43
-
44
-
45
-
46
-
47
-
48
-
49
-
50
-
51
-
52
-
53
-
54
-
55
-
56
-
57
-
58
-
59
-
60
-
61
-
62
-
63
-
64
-
65
-
66
-
67
-
68
-
69
-
70
-
71
-
72
-
73
-
74
-
75
-
76
-
77
-
78
-
79
-
80
-
81
-
82
-
83
-
84
-
85
-
86
-
87
-
88
-
89
-
90
-
91
-
92
-
93
-
94
-
95
-
96
-
97
-
98
-
99
-
100
-
101
-
102
-
103
-
104
-
105
-
106
-
107
-
108
-
109
-
110
-
111
-
112
-
113
-
114
-
115
-
116
-
117
-
118
-
119
-
120
-
121
-
122
-
123
-
124
-
125
-
126
-
127
-
128
-
129
-
130
-
131
-
132
-
133
-
134
-
135
-
136
-
137
-
138
-
139
-
140
-
141
-
142
-
143
-
144
-
145
-
146
-
147
-
148
-
149
-
150
-
151
-
152
-
153
-
154
-
155
-
156
-
157
-
158
-
159
-
160
-
161
-
162
-
163
-
164
-
165
-
166
-
167
-
168
-
169
-
170
-
171
-
172
-
173
-
174
-
175
-
176
-
177
-
178
-
179
-
180
-
181
-
182
-
183
-
184
-
185
-
186
-
187
-
188
-
189
-
190
-
191
-
192
-
193
-
194
-
195
-
196
-
197
-
198
-
 199
199 -
 200
200 -
 201
201 -
 202
202 -
 203
203 -
 204
204 -
 205
205 -
 206
206 -
 207
207 -
 208
208 -
 209
209 -
 210
210 -
 211
211 -
 212
212 -
 213
213 -
 214
214 -
 215
215 -
 216
216 -
 217
217 -
 218
218 -
 219
219 -
220
-
221
-
222
-
223
-
224
-
225
-
226
-
227
-
228
-
229
-
230
-
231
-
232
 |
 |

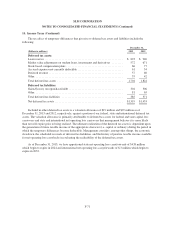
SLM CORPORATION
NOTES TO CONSOLIDATED FINANCIAL STATEMENTS (Continued)
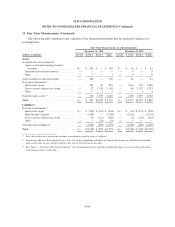
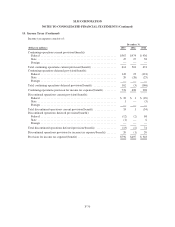
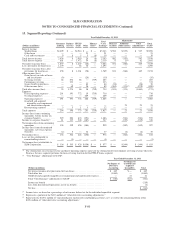
14. Income Taxes (Continued)
The tax effect of temporary differences that give rise to deferred tax assets and liabilities include the
following:
December 31,
(Dollars in millions) 2013 2012
Deferred tax assets:
Loan reserves ....................................................... $ 893 $ 940
Market value adjustments on student loans, investments and derivatives ........ 572 671
Stock-based compensation plans ........................................ 66 77
Accrued expenses not currently deductible ................................ 61 34
Deferred revenue .................................................... 57 60
Other ............................................................. 55 42
Total deferred tax assets .............................................. 1,704 1,824
Deferred tax liabilities:
Gains/(losses) on repurchased debt ...................................... 304 306
Other ............................................................. 81 65
Total deferred tax liabilities ........................................... 385 371
Net deferred tax assets ................................................ $1,319 $1,453
Included in other deferred tax assets is a valuation allowance of $19 million and $29 million as of
December 31, 2013 and 2012, respectively, against a portion of our federal, state and international deferred tax
assets. The valuation allowance is primarily attributable to deferred tax assets for federal and state capital loss
carryovers and state and international net operating loss carryovers that management believes it is more likely
than not will expire prior to being realized. The ultimate realization of the deferred tax assets is dependent upon
the generation of future taxable income of the appropriate character (i.e. capital or ordinary) during the period in
which the temporary differences become deductible. Management considers, among other things, the economic
slowdown, the scheduled reversals of deferred tax liabilities, and the history of positive taxable income available
for net operating loss carrybacks in evaluating the realizability of the deferred tax assets.
As of December 31, 2013, we have apportioned state net operating loss carryforwards of $438 million
which begin to expire in 2024 and international net operating loss carryforwards of $.3 million which begin to
expire in 2032.
F-71