Sallie Mae 2013 Annual Report Download - page 41
Download and view the complete annual report
Please find page 41 of the 2013 Sallie Mae annual report below. You can navigate through the pages in the report by either clicking on the pages listed below, or by using the keyword search tool below to find specific information within the annual report.-
 1
1 -
2
-
3
-
4
-
5
-
6
-
7
-
8
-
9
-
10
-
11
-
12
-
13
-
14
-
15
-
16
-
17
-
18
-
19
-
20
-
21
-
22
-
23
-
24
-
25
-
26
-
27
-
28
-
29
-
30
-
 31
31 -
 32
32 -
 33
33 -
 34
34 -
 35
35 -
 36
36 -
 37
37 -
 38
38 -
 39
39 -
 40
40 -
 41
41 -
 42
42 -
 43
43 -
 44
44 -
 45
45 -
 46
46 -
 47
47 -
 48
48 -
 49
49 -
 50
50 -
 51
51 -
52
-
53
-
54
-
55
-
56
-
57
-
58
-
59
-
60
-
61
-
62
-
63
-
64
-
65
-
66
-
67
-
68
-
69
-
70
-
71
-
72
-
73
-
74
-
75
-
76
-
77
-
78
-
79
-
80
-
81
-
82
-
83
-
84
-
85
-
86
-
87
-
88
-
89
-
90
-
91
-
92
-
93
-
94
-
95
-
96
-
97
-
98
-
99
-
100
-
101
-
102
-
103
-
104
-
105
-
106
-
107
-
108
-
109
-
110
-
111
-
112
-
113
-
114
-
115
-
116
-
117
-
118
-
119
-
120
-
121
-
122
-
123
-
124
-
125
-
126
-
127
-
128
-
129
-
130
-
131
-
132
-
133
-
134
-
135
-
136
-
137
-
138
-
139
-
140
-
141
-
142
-
143
-
144
-
145
-
146
-
147
-
148
-
149
-
150
-
151
-
152
-
153
-
154
-
155
-
156
-
157
-
158
-
159
-
160
-
161
-
162
-
163
-
164
-
165
-
166
-
167
-
168
-
169
-
170
-
171
-
172
-
173
-
174
-
175
-
176
-
177
-
178
-
179
-
180
-
181
-
182
-
183
-
184
-
185
-
186
-
187
-
188
-
189
-
190
-
191
-
192
-
193
-
194
-
195
-
196
-
197
-
198
-
199
-
200
-
201
-
202
-
203
-
204
-
205
-
206
-
207
-
208
-
209
-
210
-
211
-
212
-
213
-
214
-
215
-
216
-
217
-
218
-
219
-
220
-
221
-
222
-
223
-
224
-
225
-
226
-
227
-
228
-
229
-
230
-
231
-
232
 |
 |
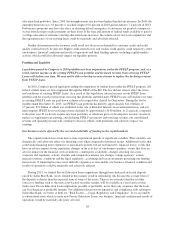
The interest rate characteristics of our earning assets do not always match the interest rate characteristics of
our funding arrangements, which may increase the price of, or decrease our ability to obtain, necessary
liquidity.
Net interest income is the primary source of cash flow generated by our portfolios of FFELP Loans and
Private Education Loans. Interest earned on FFELP Loans and Private Education Loans is primarily indexed to
one-month LIBOR rates and either one-month LIBOR rates or the one-month Prime rate, respectively, but our
cost of funds is primarily indexed to three-month LIBOR, creating the possibility of re-pricing risk related to
these assets. In a declining interest rate environment, this difference in timing may compress the net interest
margin on FFELP Loans and Private Education Loans.
The different interest rate characteristics of our loan portfolio and liabilities funding these loans also result
in basis risk and re-pricing risk. It is not possible to hedge all of our exposure to such risks. While the asset and
hedge indices are short-term with rate movements that are typically highly correlated, there can be no assurance
that the historically high correlation will not be disrupted by capital market dislocations or other factors not
within our control. In these circumstances, our earnings could be materially adversely affected.
Adverse market conditions or an inability to effectively manage our liquidity risk could negatively impact our
ability to meet our liquidity and funding needs, which could materially and adversely impact our business
operations and our overall financial condition.
We must effectively manage the liquidity risk to which we are exposed. We require liquidity to meet cash
requirements such as day-to-day operating expenses, extensions of credit on our Private Education Loans,
required payments of principal and interest on our borrowings, and distributions to our stockholders. Our primary
sources of liquidity and funding are from fees we collect for servicing education loans, payments made on
FFELP and Private Education Loans that we hold, proceeds and distributions from securitization transactions and
trusts that we undertake and offerings of debt and equity securities. We may maintain too much liquidity, which
can be costly, or we may be too illiquid, which could result in financial distress during times of financial stress or
capital market disruptions.
Unexpected and sharp changes in the overall economic environment may negatively impact the performance
of our loan and credit portfolios.
Unexpected changes in the overall economic environment, including unemployment, may result in the credit
performance of our loan portfolio being materially different from what we expect. Our earnings are dependent on
the expected future creditworthiness of our student loan customers, especially with respect to our Private
Education Loan portfolio. We maintain a reserve for credit losses based on expected future charge-offs expected
over primarily the next two years, which considers many factors, including levels of past due loans and
forbearances and expected economic conditions. However, management’s determination of the appropriate
reserve level may under- or over-estimate future losses. If the credit quality of our customer base materially
decreases, if a market risk changes significantly, or if our reserves for credit losses are not adequate, our
business, financial condition and results of operations could suffer.
We are also subject to the creditworthiness of other third parties, including counterparties to derivative
transactions. For example, we have exposure to the financial conditions of various lending, investment and
derivative counterparties. If a counterparty fails to perform its obligations, we could, depending on the type of
counterparty arrangement, experience a loss of liquidity or an economic loss. In addition, we might not be able to
cost effectively replace the derivative position depending on the type of derivative and the current economic
environment, and thus be exposed to a greater level of interest rate and/or foreign currency exchange rate risk
which could lead to additional losses. Our counterparty exposure is more fully discussed in Item 7.
“Management’s Discussion and Analysis of Financial Condition and Results of Operations — Liquidity and
Capital Resources — Counterparty Exposure.” If our counterparties are unable to perform their obligations, our
business, financial condition and results of operations could suffer.
39