Wells Fargo 2008 Annual Report Download - page 92
Download and view the complete annual report
Please find page 92 of the 2008 Wells Fargo annual report below. You can navigate through the pages in the report by either clicking on the pages listed below, or by using the keyword search tool below to find specific information within the annual report.-
 1
1 -
2
-
3
-
4
-
5
-
6
-
7
-
8
-
9
-
10
-
11
-
12
-
13
-
14
-
15
-
16
-
17
-
18
-
19
-
20
-
21
-
22
-
23
-
24
-
25
-
26
-
27
-
28
-
29
-
30
-
31
-
32
-
33
-
34
-
35
-
36
-
37
-
38
-
39
-
40
-
41
-
42
-
43
-
44
-
45
-
46
-
47
-
48
-
49
-
50
-
51
-
52
-
53
-
54
-
55
-
56
-
57
-
58
-
59
-
60
-
61
-
62
-
63
-
64
-
65
-
66
-
67
-
68
-
69
-
70
-
71
-
72
-
73
-
74
-
75
-
76
-
77
-
78
-
79
-
80
-
81
-
 82
82 -
 83
83 -
 84
84 -
 85
85 -
 86
86 -
 87
87 -
 88
88 -
 89
89 -
 90
90 -
 91
91 -
 92
92 -
 93
93 -
 94
94 -
 95
95 -
 96
96 -
 97
97 -
 98
98 -
 99
99 -
 100
100 -
 101
101 -
 102
102 -
103
-
104
-
105
-
106
-
107
-
108
-
109
-
110
-
111
-
112
-
113
-
114
-
115
-
116
-
117
-
118
-
119
-
120
-
121
-
122
-
123
-
124
-
125
-
126
-
127
-
128
-
129
-
130
-
131
-
132
-
133
-
134
-
135
-
136
-
137
-
138
-
139
-
140
-
141
-
142
-
143
-
144
-
145
-
146
-
147
-
148
-
149
-
150
-
151
-
152
-
153
-
154
-
155
-
156
-
157
-
158
-
159
-
160
-
161
-
162
-
163
-
164
-
165
-
166
-
167
-
168
-
169
-
170
-
171
-
172
 |
 |

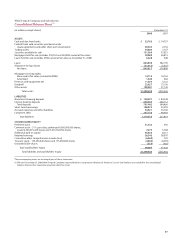
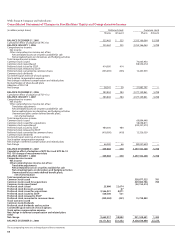
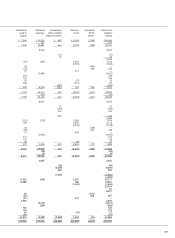
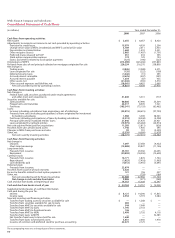
Wells Fargo & Company and Subsidiaries
Consolidated Statement of Cash Flows
(in millions) Year ended December 31,
2008 2007 2006
Cash flows from operating activities:
Net income $ 2,655 $ 8,057 $ 8,420
Adjustments to reconcile net income to net cash provided by operating activities:
Provision for credit losses 15,979 4,939 2,204
Change in fair value of MSRs (residential) and MHFS carried at fair value 3,789 2,611 2,453
Depreciation and amortization 1,669 1,532 3,221
Other net gains (losses) 2,065 (1,407) (1,701)
Preferred shares released to ESOP 451 418 355
Stock option compensation expense 174 129 134
Excess tax benefits related to stock option payments (121) (196) (227)
Originations of MHFS (213,498) (223,266) (237,841)
Proceeds from sales of and principal collected on mortgages originated for sale 220,254 216,270 238,800
Net change in:
Trading assets (3,045) (3,388) 5,271
Loans originated for sale (135) (222) (109)
Deferred income taxes (1,642) (31) 593
Accrued interest receivable (2,676) (407) (291)
Accrued interest payable 1,634 (87) 455
Other assets, net (21,443) (365) 3,570
Other accrued expenses and liabilities, net (10,941) 4,491 2,669
Net cash provided (used) by operating activities (4,831) 9,078 27,976
Cash flows from investing activities:
Net change in:
Federal funds sold, securities purchased under resale agreements
and other short-term investments 51,049 3,331 (717)
Securities available for sale:
Sales proceeds 60,806 47,990 53,304
Prepayments and maturities 24,317 8,505 7,321
Purchases (105,341) (75,129) (62,462)
Loans:
Increase in banking subsidiaries’ loan originations, net of collections (54,815) (48,615) (37,730)
Proceeds from sales (including participations) of loans originated for investment
by banking subsidiaries 1,988 3,369 38,343
Purchases (including participations) of loans by banking subsidiaries (5,513) (8,244) (5,338)
Principal collected on nonbank entities’ loans 21,846 21,476 23,921
Loans originated by nonbank entities (19,973) (25,284) (26,974)
Net cash acquired from (paid for) acquisitions 11,203 (2,811) (626)
Proceeds from sales of foreclosed assets 1,746 1,405 593
Changes in MSRs from purchases and sales 92 791 (3,539)
Other, net (5,576) (4,099) (2,678)
Net cash used by investing activities (18,171) (77,315) (16,582)
Cash flows from financing activities:
Net change in:
Deposits 7,697 27,058 (4,452)
Short-term borrowings (14,888) 39,827 (11,156)
Long-term debt:
Proceeds from issuance 35,701 29,360 20,255
Repayment (29,859) (18,250) (12,609)
Common stock:
Proceeds from issuance 14,171 1,876 1,764
Repurchased (1,623) (7,418) (1,965)
Cash dividends paid (4,312) (3,955) (3,641)
Preferred stock:
Proceeds from issuance 22,674 ——
Proceeds from issuance of stock warrants 2,326 ——
Excess tax benefits related to stock option payments 121 196 227
Other, net — (728) (186)
Net cash provided (used) by financing activities 32,008 67,966 (11,763)
Net change in cash and due from banks 9,006 (271) (369)
Cash and due from banks at beginning of year 14,757 15,028 15,397
Cash and due from banks at end of year $ 23,763 $ 14,757 $ 15,028
Supplemental disclosures of cash flow information:
Cash paid during the year for:
Interest $ 8,121 $ 14,290 $ 11,833
Income taxes 2,554 3,719 3,084
Noncash investing and financing activities:
Transfers from trading assets to securities available for sale $—$ 1,268 $ —
Transfers from securities available for sale to loans 283 ——
Transfers from MHFS to securities available for sale 544 7,949 —
Transfers from MHFS to loans 1,195 2,133 —
Transfers from MHFS to foreclosed assets 136 ——
Transfers from MHFS to MSRs 3,498 3,720 4,118
Transfers from loans to MHFS —— 32,383
Net transfers from loans to loans held for sale 1,640 ——
Transfers from loans to foreclosed assets 3,031 2,666 1,918
Issuance of common and preferred stock for purchase accounting 22,672 2,125 —
The accompanying notes are an integral part of these statements.