Wells Fargo 2008 Annual Report Download - page 54
Download and view the complete annual report
Please find page 54 of the 2008 Wells Fargo annual report below. You can navigate through the pages in the report by either clicking on the pages listed below, or by using the keyword search tool below to find specific information within the annual report.-
 1
1 -
2
-
3
-
4
-
5
-
6
-
7
-
8
-
9
-
10
-
11
-
12
-
13
-
14
-
15
-
16
-
17
-
18
-
19
-
20
-
21
-
22
-
23
-
24
-
25
-
26
-
27
-
28
-
29
-
30
-
31
-
32
-
33
-
34
-
35
-
36
-
37
-
38
-
39
-
40
-
41
-
42
-
43
-
 44
44 -
 45
45 -
 46
46 -
 47
47 -
 48
48 -
 49
49 -
 50
50 -
 51
51 -
 52
52 -
 53
53 -
 54
54 -
 55
55 -
 56
56 -
 57
57 -
 58
58 -
 59
59 -
 60
60 -
 61
61 -
 62
62 -
 63
63 -
 64
64 -
65
-
66
-
67
-
68
-
69
-
70
-
71
-
72
-
73
-
74
-
75
-
76
-
77
-
78
-
79
-
80
-
81
-
82
-
83
-
84
-
85
-
86
-
87
-
88
-
89
-
90
-
91
-
92
-
93
-
94
-
95
-
96
-
97
-
98
-
99
-
100
-
101
-
102
-
103
-
104
-
105
-
106
-
107
-
108
-
109
-
110
-
111
-
112
-
113
-
114
-
115
-
116
-
117
-
118
-
119
-
120
-
121
-
122
-
123
-
124
-
125
-
126
-
127
-
128
-
129
-
130
-
131
-
132
-
133
-
134
-
135
-
136
-
137
-
138
-
139
-
140
-
141
-
142
-
143
-
144
-
145
-
146
-
147
-
148
-
149
-
150
-
151
-
152
-
153
-
154
-
155
-
156
-
157
-
158
-
159
-
160
-
161
-
162
-
163
-
164
-
165
-
166
-
167
-
168
-
169
-
170
-
171
-
172
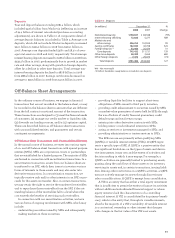
 |
 |

Operating losses in 2008 included a $151 million reversal
of Visa litigation expenses related to the Visa initial public
offering. Operating losses for 2007 included $203 million for
2007 of litigation expenses associated with indemnification
obligations arising from our ownership interest in Visa.
Income Tax Expense
Our effective tax rate for 2008 was 18.5%, compared with
30.7% for 2007. The decrease in the effective tax rate was
primarily due to a lower level of pre-tax income and higher
amounts of tax credits and tax-exempt income.
Operating Segment Results
We have three lines of business for our 2008 management
reporting results: Community Banking, Wholesale Banking
and Wells Fargo Financial. For a more complete description
of our operating segments, including additional financial
information and the underlying management accounting
process, see Note 24 (Operating Segments) to Financial
Statements. To reflect the realignment of our corporate trust
business from Community Banking into Wholesale Banking
in first quarter 2008, results for prior periods have been
revised.
Community Banking’s net income decreased 43% to $2.93 bil-
lion in 2008 from $5.11 billion in 2007. Double-digit revenue
growth was driven by strong balance sheet growth, combined
with disciplined expense management, and was offset by
higher credit costs, including a $4.7 billion (pre tax) credit
reserve build. Revenue increased 11% to $27.76 billion from
$24.93 billion in 2007. Net interest income increased 24% to
$16.19 billion in 2008 from $13.10 billion in 2007. Net interest
margin increased 36 basis points to 5.02% due to earning
assets growth of $41.4 billion, or 15%, offsetting lower invest-
ment yields. The growth in earning assets was primarily
driven by loan and investment growth. Average loans were
up 13% to $218.8 billion in 2008 from $194.0 billion in 2007.
Average core deposits were up 5% to $254.6 billion in 2008
from $242.2 billion a year ago. Noninterest income decreased
2% to $11.57 billion in 2008 from $11.83 billion in 2007,
primarily due to lower mortgage banking income and trust
and investment fees. The provision for credit losses for
2008 increased to $9.56 billion from $3.19 billion in 2007.
Noninterest expense decreased 2% to $14.35 billion in 2008
from $14.70 billion in 2007.
Wholesale Banking’s net income decreased 48% to $1.29 bil-
lion in 2008 from $2.47 billion in 2007, largely due to the
$1.12 billion (pre tax) provision for credit losses, which
included a $586 million (pre tax) credit reserve build.
Revenue decreased 5% to $8.54 billion from $8.95 billion in
2007. Net interest income increased 23% to $4.47 billion for
2008 from $3.65 billion for 2007 driven by strong loan and
deposit growth. Average loans increased 31% to $112.1 billion
in 2008 from $85.6 billion in 2007, with double-digit increases
across nearly all wholesale lending businesses. Average core
deposits grew 16% to $70.6 billion from a year ago, primarily
from large corporate, middle market and correspondent bank-
ing customers. The increase in provision for credit losses to
$1.12 billion in 2008 from $69 million in 2007 was due to higher
net charge-offs and additional provision taken to build
reserves for the wholesale portfolio. Noninterest income
decreased 23% to $4.07 billion in 2008, primarily due to
impairment charges and other losses in our capital markets
areas, as well as lower commercial real estate brokerage and
trust and investment fees. Noninterest expense increased 9%
to $5.55 billion in 2008 from $5.08 billion in 2007, due to the
acquisition of ABD Insurance as well as higher agent com-
missions in the crop insurance business stemming from higher
commodity prices and the liability recorded for a capital
support agreement for a structured investment vehicle.
Wells Fargo Financial reported a net loss of $764 million in
2008 compared with net income of $481 million in 2007,
reflecting higher credit costs, including a $1.7 billion credit
reserve build due to continued softening in the real estate,
auto and credit card markets. Revenue was up 2% to $5.59 bil-
lion in 2008 from $5.51 billion in 2007. Net interest income
increased 6% to $4.48 billion from $4.23 billion in 2007 due to
growth in average loans, which increased 4% to $67.6 billion
in 2008 from $65.2 billion in 2007. The provision for credit
losses increased $2.38 billion in 2008 from 2007, primarily
due to the $1.7 billion credit reserve build, and an increase in
net charge-offs in the credit card and auto portfolios due to
continued softening in these markets. Noninterest income
decreased $171 million in 2008 from 2007. Noninterest
expense decreased 9% to $2.76 billion in 2008 from 2007, pri-
marily due to lower expenses from the run off of the auto
lease portfolio and reduction in team members.
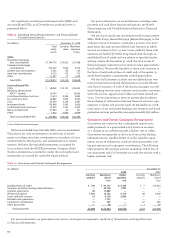
Table 6: Noninterest Expense
(in millions) Year ended December 31, % Change
2008 2007 2006 2008/ 2007/
2007 2006
Salaries $ 8,260 $ 7,762 $ 7,007 6% 11%
Commission and
incentive compensation 2,676 3,284 2,885 (19) 14
Employee benefits 2,004 2,322 2,035 (14) 14
Equipment 1,357 1,294 1,252 53
Net occupancy 1,619 1,545 1,405 510
Operating leases 389 561 630 (31) (11)
Outside professional services 847 899 942 (6) (5)
Insurance 725 416 257 74 62
Outside data processing 480 482 437 —10
Travel and entertainment 447 474 542 (6) (13)
Contract services 407 448 579 (9) (23)
Advertising and promotion 378 412 456 (8) (10)
Postage 338 345 312 (2) 11
Telecommunications 321 321 279 —15
Stationery and supplies 218 220 223 (1) (1)
Core deposit and other
customer relationship
intangibles 186 158 177 18 (11)
Security 178 176 179 1(2)
Operating losses 142 437 275 (68) 59
All other 1,689 1,268 965 33 31
Total $22,661 $22,824 $20,837 (1) 10