Wells Fargo 2008 Annual Report Download - page 48
Download and view the complete annual report
Please find page 48 of the 2008 Wells Fargo annual report below. You can navigate through the pages in the report by either clicking on the pages listed below, or by using the keyword search tool below to find specific information within the annual report.-
 1
1 -
2
-
3
-
4
-
5
-
6
-
7
-
8
-
9
-
10
-
11
-
12
-
13
-
14
-
15
-
16
-
17
-
18
-
19
-
20
-
21
-
22
-
23
-
24
-
25
-
26
-
27
-
28
-
29
-
30
-
31
-
32
-
33
-
34
-
35
-
36
-
37
-
 38
38 -
 39
39 -
 40
40 -
 41
41 -
 42
42 -
 43
43 -
 44
44 -
 45
45 -
 46
46 -
 47
47 -
 48
48 -
 49
49 -
 50
50 -
 51
51 -
 52
52 -
 53
53 -
 54
54 -
 55
55 -
 56
56 -
 57
57 -
 58
58 -
59
-
60
-
61
-
62
-
63
-
64
-
65
-
66
-
67
-
68
-
69
-
70
-
71
-
72
-
73
-
74
-
75
-
76
-
77
-
78
-
79
-
80
-
81
-
82
-
83
-
84
-
85
-
86
-
87
-
88
-
89
-
90
-
91
-
92
-
93
-
94
-
95
-
96
-
97
-
98
-
99
-
100
-
101
-
102
-
103
-
104
-
105
-
106
-
107
-
108
-
109
-
110
-
111
-
112
-
113
-
114
-
115
-
116
-
117
-
118
-
119
-
120
-
121
-
122
-
123
-
124
-
125
-
126
-
127
-
128
-
129
-
130
-
131
-
132
-
133
-
134
-
135
-
136
-
137
-
138
-
139
-
140
-
141
-
142
-
143
-
144
-
145
-
146
-
147
-
148
-
149
-
150
-
151
-
152
-
153
-
154
-
155
-
156
-
157
-
158
-
159
-
160
-
161
-
162
-
163
-
164
-
165
-
166
-
167
-
168
-
169
-
170
-
171
-
172
 |
 |
We use four key variables to calculate our annual pension
cost: size and characteristics of the employee population,
actuarial assumptions, expected long-term rate of return on
plan assets, and discount rate. We describe below the effect
of each of these variables on our pension expense.
SIZE AND CHARACTERISTICS OF THE EMPLOYEE POPULATION
Pension expense is directly related to the number of employ-
ees covered by the plans, and other factors including salary,
age and years of employment.
ACTUARIAL ASSUMPTIONS To estimate the projected benefit
obligation, actuarial assumptions are required about factors
such as the rates of mortality, turnover, retirement, disability
and compensation increases for our participant population.
These demographic assumptions are reviewed periodically.
In general, the range of assumptions is narrow.
EXPECTED LONG-TERM RATE OF RETURN ON PLAN ASSETS We
determine the expected return on plan assets each year based
on the composition of assets and the expected long-term rate
of return on that portfolio. The expected long-term rate of
return assumption is a long-term assumption and is not
anticipated to change significantly from year to year.
To determine if the expected rate of return is reasonable,
we consider such factors as (1) long-term historical return
experience for major asset class categories (for example,
large cap and small cap domestic equities, international
equities and domestic fixed income), and (2) forward-looking
return expectations for these major asset classes. Our expected
rate of return for 2009 is 8.75%, the same rate used for 2008
and 2007. Differences in each year, if any, between expected
and actual returns are included in our net actuarial gain or
loss amount, which is recognized in other comprehensive
income. We generally amortize any net actuarial gain or loss
in excess of a 5% corridor (as defined in FAS 87) in net peri-
odic pension expense calculations over the next five years.
Due to the dramatic downturn in market conditions during
2008, our actual rate of return for 2008 was negative, and was
therefore significantly less than our long-term expected rate
of return of 8.75%. This difference will increase our 2009 pen-
sion expense by approximately $600 million due to higher
actuarial loss amortization combined with a lower rate of
return component of pension expense, as compared to our
2008 pension expense. Although our plan assets experienced
a negative return in 2008, our plan assets have earned an
average annualized rate of return of about 9% over the last
25 years. Our average remaining service period is approxi-
mately 10 years. See Note 20 (Employee Benefits and Other
Expenses) to Financial Statements for information on funding,
changes in the pension benefit obligation, and plan assets
(including the investment categories, asset allocation and
the fair value).
If we were to assume a 1% increase/decrease in the expected
long-term rate of return, holding the discount rate and other
actuarial assumptions constant, 2009 pension expense would
decrease/increase by approximately $74 million.
DISCOUNT RATE We use a discount rate to determine the pre-
sent value of our future benefit obligations. The discount rate
reflects the current rates available on long-term high-quality
fixed-income debt instruments, and is reset annually on the
measurement date. To determine the discount rate, we
review, with our independent actuary, spot interest rate yield
curves based upon yields from a broad population of high-
quality bonds, adjusted to match the timing and amounts of
the Cash Balance Plan’s expected benefit payments. We used
a discount rate of 6.75% in 2008 and 6.25% in 2007.
If we were to assume a 1% increase in the discount rate,
and keep the expected long-term rate of return and other
actuarial assumptions constant, pension expense would
decrease by approximately $72 million. If we were to assume
a 1% decrease in the discount rate, and keep other assump-
tions constant, 2009 pension expense would increase by
approximately $70 million. The decrease in pension expense
due to a 1% increase in discount rate differs slightly from the
increase in pension expense due to a 1% decrease in discount
rate due to the impact of the 5% gain/loss corridor.
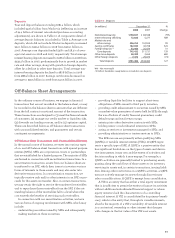
Income Taxes
We are subject to the income tax laws of the U.S., its states
and municipalities and those of the foreign jurisdictions in
which we operate. We account for income taxes in accor-
dance with FAS 109, Accounting for Income Taxes, as inter-
preted by FIN 48, Accounting for Uncertainty in Income Taxes.
Our income tax expense consists of two components: current
and deferred. Current income tax expense approximates
taxes to be paid or refunded for the current period and
includes income tax expense related to our uncertain tax
positions. We determine deferred income taxes using the bal-
ance sheet method. Under this method, the net deferred tax
asset or liability is based on the tax effects of the differences
between the book and tax bases of assets and liabilities, and
recognized enacted changes in tax rates and laws in the peri-
od in which they occur. Deferred income tax expense results
from changes in deferred tax assets and liabilities between
periods. Deferred tax assets are recognized subject to man-
agement’s judgment that realization is “more likely than not.”
Uncertain tax positions that meet the more likely than not
recognition threshold are measured to determine the amount
of benefit to recognize. An uncertain tax position is measured
at the largest amount of benefit that management believes is
greater than 50% likely of being realized upon settlement.
Foreign taxes paid are generally applied as credits to reduce
federal income taxes payable. We account for interest and
penalties as a component of income tax expense.
The income tax laws of the jurisdictions in which we oper-
ate are complex and subject to different interpretations by
the taxpayer and the relevant government taxing authorities.
In establishing a provision for income tax expense, we must
make judgments and interpretations about the application of
these inherently complex tax laws. We must also make esti-
mates about when in the future certain items will affect tax-
able income in the various tax jurisdictions by the govern-