Wells Fargo 2008 Annual Report Download - page 138
Download and view the complete annual report
Please find page 138 of the 2008 Wells Fargo annual report below. You can navigate through the pages in the report by either clicking on the pages listed below, or by using the keyword search tool below to find specific information within the annual report.-
 1
1 -
2
-
3
-
4
-
5
-
6
-
7
-
8
-
9
-
10
-
11
-
12
-
13
-
14
-
15
-
16
-
17
-
18
-
19
-
20
-
21
-
22
-
23
-
24
-
25
-
26
-
27
-
28
-
29
-
30
-
31
-
32
-
33
-
34
-
35
-
36
-
37
-
38
-
39
-
40
-
41
-
42
-
43
-
44
-
45
-
46
-
47
-
48
-
49
-
50
-
51
-
52
-
53
-
54
-
55
-
56
-
57
-
58
-
59
-
60
-
61
-
62
-
63
-
64
-
65
-
66
-
67
-
68
-
69
-
70
-
71
-
72
-
73
-
74
-
75
-
76
-
77
-
78
-
79
-
80
-
81
-
82
-
83
-
84
-
85
-
86
-
87
-
88
-
89
-
90
-
91
-
92
-
93
-
94
-
95
-
96
-
97
-
98
-
99
-
100
-
101
-
102
-
103
-
104
-
105
-
106
-
107
-
108
-
109
-
110
-
111
-
112
-
113
-
114
-
115
-
116
-
117
-
118
-
119
-
120
-
121
-
122
-
123
-
124
-
125
-
126
-
127
-
 128
128 -
 129
129 -
 130
130 -
 131
131 -
 132
132 -
 133
133 -
 134
134 -
 135
135 -
 136
136 -
 137
137 -
 138
138 -
 139
139 -
 140
140 -
 141
141 -
 142
142 -
 143
143 -
 144
144 -
 145
145 -
 146
146 -
 147
147 -
 148
148 -
149
-
150
-
151
-
152
-
153
-
154
-
155
-
156
-
157
-
158
-
159
-
160
-
161
-
162
-
163
-
164
-
165
-
166
-
167
-
168
-
169
-
170
-
171
-
172
 |
 |

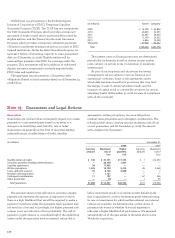
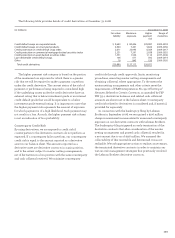
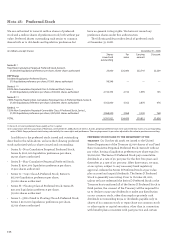
(in millions) December 31,
2008 2007
Notional or Fair valueNotional or Fair value
contractual Asset Liability contractual Asset Liability
amount derivatives derivatives amount derivatives derivatives
ASSET/LIABILITY MANAGEMENT HEDGES
Qualifying hedge contracts
accounted for under FAS 133
Interest rate contracts:
Swaps $ 115,597 $ 11,249 $ 2,963 $ 47,408 $ 1,411 $ 267
Futures 67,375 — 324 50 — —
Floors and caps purchased 9,000 262 — 250 8 —
Floors and caps written ——— 250 — 5
Equity contracts:
Options purchased ——— 1——
Options written ——— 3— 3
Foreign exchange contracts:
Swaps 19,022 1,117 1,191 12,048 1,399 23
Forwards and spots 19,364 21 7 ———
Free-standing derivatives (economic hedges)
Interest rate contracts (1):
Swaps 218,922 7,902 7,674 43,835 933 421
Futures 118,718 — — 56,023 — —
Options purchased 13,613 1,021 — 16,250 156 —
Options written 12,950 — 744 3,500 — 20
Forwards 386,525 3,712 1,290 353,095 1,094 287
Foreign exchange contracts:
Swaps 603 55 — 603 202 —
Forwards and spots 3,605 95 325 ———
Credit contracts:
Swaps 644 528 — ———
Other derivatives:
Forward commitments 4,458 108 71 ———
CUSTOMER ACCOMMODATION, TRADING AND
OTHER FREE-STANDING DERIVATIVES
Interest rate contracts:
Swaps 3,127,009 133,551 132,186 195,144 3,584 3,196
Futures 48,011 — 140 33,443 — —
Floors and caps purchased 104,355 2,000 1 21,629 143 —
Floors and caps written 111,674 — 1,609 24,466 — 124
Options purchased 89,813 6,480 3 2,573 88 —
Options written 138,912 159 6,796 19,074 35 95
Forwards 132,882 549 773 131,959 43 34
Commodity contracts:
Swaps 58,579 4,170 4,226 5,053 367 415
Futures 11,004 821 480 1,417 — —
Floors and caps purchased 6,566 899 — 1,869 290 —
Floors and caps written 7,142 — 1,249 1,738 — 151
Options purchased 1,885 227 — 761 74 —
Options written 1,184 — 113 552 — 49
Equity contracts:
Swaps 1,563 76 81 291 63 44
Futures 282 — 23 138 — —
Options purchased 18,658 3,003 1 4,966 508 —
Options written 16,488 — 2,496 4,416 — 433
Forwards 145 9 77 74 — 8
Foreign exchange contracts:
Swaps 56,100 1,038 1,011 5,797 199 219
Futures —— 5 155 — —
Floors and caps purchased 13 3— ———
Options purchased 7,888 532 — 3,229 107 —
Options written 7,181 — 491 3,168 — 100
Forwards and spots 202,255 5,989 5,912 40,371 420 335
Credit contracts:
Swaps 254,107 18,226 18,996 2,752 75 24
Other credit derivatives 18,615 3,727 2,791 ———
Other derivatives:
Total return swaps 5,264 523 385 ———
Other 1,058 1 139 — — —
Subtotal 208,053 194,573 11,199 6,253
NETTING (2) (168,690) (182,435) (3,709) (3,709)
Total $ 39,363 $ 12,138 $ 7,490 $ 2,544
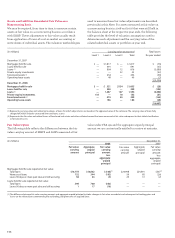
(1) Includes free-standing derivatives (economic hedges) used to hedge the risk of changes in the fair value of residential MSRs, MHFS, interest rate lock commitments
and other interests held.
(2) Represents netting of derivative asset and liability balances, and related cash collateral, with the same counterparty subject to master netting arrangements under FIN 39.
The amount of cash collateral netted against derivative assets and liabilities was $17.7 billion and $22.2 billion, respectively, at December 31, 2008.
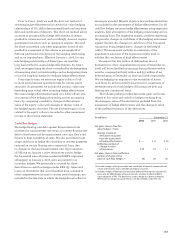
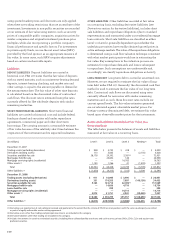
The total notional or contractual amounts and fair values for derivatives were: