Wells Fargo 2008 Annual Report Download - page 154
Download and view the complete annual report
Please find page 154 of the 2008 Wells Fargo annual report below. You can navigate through the pages in the report by either clicking on the pages listed below, or by using the keyword search tool below to find specific information within the annual report.-
 1
1 -
2
-
3
-
4
-
5
-
6
-
7
-
8
-
9
-
10
-
11
-
12
-
13
-
14
-
15
-
16
-
17
-
18
-
19
-
20
-
21
-
22
-
23
-
24
-
25
-
26
-
27
-
28
-
29
-
30
-
31
-
32
-
33
-
34
-
35
-
36
-
37
-
38
-
39
-
40
-
41
-
42
-
43
-
44
-
45
-
46
-
47
-
48
-
49
-
50
-
51
-
52
-
53
-
54
-
55
-
56
-
57
-
58
-
59
-
60
-
61
-
62
-
63
-
64
-
65
-
66
-
67
-
68
-
69
-
70
-
71
-
72
-
73
-
74
-
75
-
76
-
77
-
78
-
79
-
80
-
81
-
82
-
83
-
84
-
85
-
86
-
87
-
88
-
89
-
90
-
91
-
92
-
93
-
94
-
95
-
96
-
97
-
98
-
99
-
100
-
101
-
102
-
103
-
104
-
105
-
106
-
107
-
108
-
109
-
110
-
111
-
112
-
113
-
114
-
115
-
116
-
117
-
118
-
119
-
120
-
121
-
122
-
123
-
124
-
125
-
126
-
127
-
128
-
129
-
130
-
131
-
132
-
133
-
134
-
135
-
136
-
137
-
138
-
139
-
140
-
141
-
142
-
143
-
 144
144 -
 145
145 -
 146
146 -
 147
147 -
 148
148 -
 149
149 -
 150
150 -
 151
151 -
 152
152 -
 153
153 -
 154
154 -
 155
155 -
 156
156 -
 157
157 -
 158
158 -
 159
159 -
 160
160 -
 161
161 -
 162
162 -
 163
163 -
 164
164 -
165
-
166
-
167
-
168
-
169
-
170
-
171
-
172
 |
 |

Year ended December 31,
2008 2007 2006
Pension Other Pension Other Pension Other
benefits(1) benefits benefits (1) benefits benefits(1) benefits
Discount rate 6.25% 6.25% 5.75% 5.75% 5.75% 5.75%
Expected return on plan assets 8.75 8.75 8.75 8.75 8.75 8.75
Rate of compensation increase 4.0 — 4.0 — 4.0 —
(1) Includes both qualified and nonqualified pension benefits.
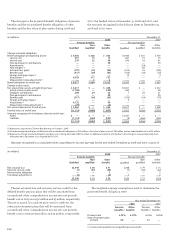
The weighted-average assumptions used to determine the net periodic benefit cost were:
The long-term rate of return assumptions above were
derived based on a combination of factors including
(1) long-term historical return experience for major asset
class categories (for example, large cap and small cap
domestic equities, international equities and domestic fixed
income), and (2) forward-looking return expectations for
these major asset classes.
To account for postretirement health care plans we use
health care cost trend rates to recognize the effect of expected
changes in future health care costs due to medical inflation,
utilization changes, new technology, regulatory requirements
and Medicare cost shifting. We assumed average annual
increases of approximately 9% (before age 65) and 8.5% (after
age 65) for health care costs for 2009. The rates of average
annual increases are assumed to trend down 0.5% each year
until the trend rates reach an ultimate trend of 5% in 2017
(before age 65) and 2016 (after age 65). Increasing the
assumed health care trend by one percentage point in each
year would increase the benefit obligation as of December 31,
2008, by $60 million and the total of the interest cost and
service cost components of the net periodic benefit cost for
2008 by $5 million. Decreasing the assumed health care trend
by one percentage point in each year would decrease the
benefit obligation as of December 31, 2008, by $55 million
and the total of the interest cost and service cost components
of the net periodic benefit cost for 2008 by $4 million.
The investment strategy for assets held in the Retiree
Medical Plan Voluntary Employees’ Beneficiary Association
(VEBA) trust and other pension plans is maintained separate
from the strategy for the assets in the Cash Balance Plan and
Pension Plan. The general target asset mix is 45–65% equities
and 35–55% fixed income. In addition, the strategy for the
VEBA trust assets considers the effect of income taxes by
utilizing a combination of variable annuity and low turnover
investment strategies. Members of the EBRC formally review
the investment risk and performance of these assets on a
quarterly basis.
Other benefits payments are expected to be reduced by
prescription drug subsidies from the federal government
provided by the Medicare Prescription Drug, Improvement
and Modernization Act of 2003, as follows:
(in millions) Pension benefits
Non- Other
Qualified qualified benefits
Year ended December 31,
2009 $ 802 $ 82 $117
2010 825 80 121
2011 823 80 125
2012 849 69 127
2013 971 65 129
2014-2018 4,659 330 653
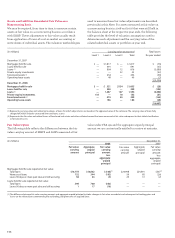
Future benefits, reflecting expected future service
that we expect to pay under the pension and other benefit
plans, follow.
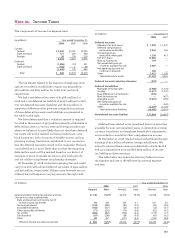
(in millions) Year ended December 31,
2008 2007 2006
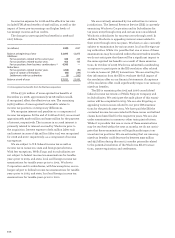
Outside professional services $847 $899 $942
Insurance 725 416 257
Travel and entertainment 447 474 542
Contract services 407 448 579
Other Expenses
Expenses exceeding 1% of total interest income and noninterest
income in any of the years presented that are not otherwise
shown separately in the financial statements or Notes to
Financial Statements were:
(in millions) Other benefits
subsidy receipts
Year ended December 31,
2009 $19
2010 20
2011 22
2012 23
2013 24
2014-2018 84