Wells Fargo 2008 Annual Report Download - page 153
Download and view the complete annual report
Please find page 153 of the 2008 Wells Fargo annual report below. You can navigate through the pages in the report by either clicking on the pages listed below, or by using the keyword search tool below to find specific information within the annual report.-
 1
1 -
2
-
3
-
4
-
5
-
6
-
7
-
8
-
9
-
10
-
11
-
12
-
13
-
14
-
15
-
16
-
17
-
18
-
19
-
20
-
21
-
22
-
23
-
24
-
25
-
26
-
27
-
28
-
29
-
30
-
31
-
32
-
33
-
34
-
35
-
36
-
37
-
38
-
39
-
40
-
41
-
42
-
43
-
44
-
45
-
46
-
47
-
48
-
49
-
50
-
51
-
52
-
53
-
54
-
55
-
56
-
57
-
58
-
59
-
60
-
61
-
62
-
63
-
64
-
65
-
66
-
67
-
68
-
69
-
70
-
71
-
72
-
73
-
74
-
75
-
76
-
77
-
78
-
79
-
80
-
81
-
82
-
83
-
84
-
85
-
86
-
87
-
88
-
89
-
90
-
91
-
92
-
93
-
94
-
95
-
96
-
97
-
98
-
99
-
100
-
101
-
102
-
103
-
104
-
105
-
106
-
107
-
108
-
109
-
110
-
111
-
112
-
113
-
114
-
115
-
116
-
117
-
118
-
119
-
120
-
121
-
122
-
123
-
124
-
125
-
126
-
127
-
128
-
129
-
130
-
131
-
132
-
133
-
134
-
135
-
136
-
137
-
138
-
139
-
140
-
141
-
142
-
 143
143 -
 144
144 -
 145
145 -
 146
146 -
 147
147 -
 148
148 -
 149
149 -
 150
150 -
 151
151 -
 152
152 -
 153
153 -
 154
154 -
 155
155 -
 156
156 -
 157
157 -
 158
158 -
 159
159 -
 160
160 -
 161
161 -
 162
162 -
 163
163 -
164
-
165
-
166
-
167
-
168
-
169
-
170
-
171
-
172
 |
 |

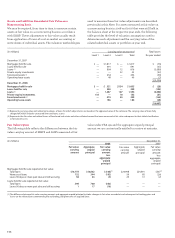
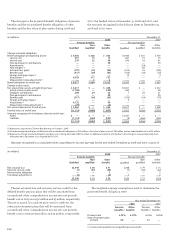
The table below provides information for pension plans
with benefit obligations in excess of plan assets.
(in millions) December 31,
2008 2007
Projected benefit obligation $9,661 $463
Accumulated benefit obligation 9,423 422
Fair value of plan assets 7,863 88
The accumulated benefit obligation for the defined
benefit pension plans was $9,423 million and $4,734 million
at December 31, 2008 and 2007, respectively.
We seek to achieve the expected long-term rate of return
with a prudent level of risk given the benefit obligations
of the pension plans and their funded status. We target the
asset allocation for our Cash Balance Plan and Pension Plan
at a target mix range of 35-65% equities, 20–50% fixed income,
and approximately 15% in real estate, venture capital, private
equity and other investments. The target ranges referenced
above account for the employment of an asset allocation
methodology designed to overweight stocks or bonds when
a compelling opportunity exists. The Employee Benefit
Review Committee (EBRC), which includes several members
of senior management, formally reviews the investment risk
and performance of our Cash Balance Plan on a quarterly
basis and will incorporate the Pension Plan into this process
starting in 2009. Annual Plan liability analysis and periodic
asset/liability evaluations are also conducted.
The components of net periodic benefit cost were:
(in millions) Year ended December 31,
2008 2007 2006
Pension benefits Pension benefits Pension benefits
Non- Other Non- Other Non- Other
Qualified qualified benefits Qualified qualified benefits Qualified qualified benefits
Service cost $ 291 $ 15 $ 13 $ 281 $ 15 $ 15 $ 247 $16 $ 15
Interest cost 276 22 40 246 18 41 224 16 39
Expected return on plan assets (478) — (41) (452) — (36) (421) — (31)
Amortization of
net actuarial loss (1) 113 1 32 13 5 56 6 5
Amortization of
prior service cost —(5)(4) — (3) (4) — (1) (4)
Special termination benefits ——— ——— 2——
Curtailment gain ——— ——— —— (9)
Settlement — — — 1 — — 5 3 —
Net periodic benefit cost 90 45 9 108 43 21 $ 113 $40 $ 15
Other changes in
plan assets and
benefit obligations
recognized in other
comprehensive income:
Net actuarial loss (gain) 2,102 (16) 79 (213) 16 (126)
Amortization of net
actuarial loss (1) (13) (1) (33) (13) (5)
Prior service cost ——— — (24) —
Amortization of prior
service cost —54 —34
Translation adjustments (5) — (4) 3 — 2
Total recognized in other
comprehensive income 2,096 (24) 78 (243) (18) (125)
Total recognized in
net periodic benefit
cost and other
comprehensive income $2,186 $ 21 $ 87 $(135) $ 25 $(104)
(1) Net actuarial loss is generally amortized over five years.
The weighted-average allocation of plan assets was:
Percentage of plan assets at December 31,
2008 2007
Pension Other Pension Other
plan benefit plan benefit
assets plan assets (1) assets plan assets
Equity securities 54% 54% 67% 63%
Debt securities 34 41 26 34
Real estate 52 42
Other 7 3 3 1
Total 100% 100% 100% 100%
(1) Excludes approximately $46 million in assets associated with Wachovia Retiree
Medical Benefit plans, which are invested in a combination of municipal bonds,
money market investments and a Trust Owned Life insurance policy for the
purpose of paying claims.