Wells Fargo 2008 Annual Report Download - page 61
Download and view the complete annual report
Please find page 61 of the 2008 Wells Fargo annual report below. You can navigate through the pages in the report by either clicking on the pages listed below, or by using the keyword search tool below to find specific information within the annual report.-
 1
1 -
2
-
3
-
4
-
5
-
6
-
7
-
8
-
9
-
10
-
11
-
12
-
13
-
14
-
15
-
16
-
17
-
18
-
19
-
20
-
21
-
22
-
23
-
24
-
25
-
26
-
27
-
28
-
29
-
30
-
31
-
32
-
33
-
34
-
35
-
36
-
37
-
38
-
39
-
40
-
41
-
42
-
43
-
44
-
45
-
46
-
47
-
48
-
49
-
50
-
 51
51 -
 52
52 -
 53
53 -
 54
54 -
 55
55 -
 56
56 -
 57
57 -
 58
58 -
 59
59 -
 60
60 -
 61
61 -
 62
62 -
 63
63 -
 64
64 -
 65
65 -
 66
66 -
 67
67 -
 68
68 -
 69
69 -
 70
70 -
 71
71 -
72
-
73
-
74
-
75
-
76
-
77
-
78
-
79
-
80
-
81
-
82
-
83
-
84
-
85
-
86
-
87
-
88
-
89
-
90
-
91
-
92
-
93
-
94
-
95
-
96
-
97
-
98
-
99
-
100
-
101
-
102
-
103
-
104
-
105
-
106
-
107
-
108
-
109
-
110
-
111
-
112
-
113
-
114
-
115
-
116
-
117
-
118
-
119
-
120
-
121
-
122
-
123
-
124
-
125
-
126
-
127
-
128
-
129
-
130
-
131
-
132
-
133
-
134
-
135
-
136
-
137
-
138
-
139
-
140
-
141
-
142
-
143
-
144
-
145
-
146
-
147
-
148
-
149
-
150
-
151
-
152
-
153
-
154
-
155
-
156
-
157
-
158
-
159
-
160
-
161
-
162
-
163
-
164
-
165
-
166
-
167
-
168
-
169
-
170
-
171
-
172
 |
 |

dential mortgages where credit performance had deteriorated
beyond our expectations, specifically high combined loan-to-
value home equity loans sourced through third party chan-
nels not behind a Wells Fargo first mortgage.
We believe our underwriting process is well controlled
and appropriate for the needs of our customers as well as
investors who purchase the loans or securities collateralized
by the loans. We only approve applications and make loans if
we believe the customer has the ability to repay the loan or
line of credit according to all its terms. We have significantly
tightened our bank-selected reduced documentation require-
ments as a precautionary measure and substantially reduced
third party originations due to the negative loss trends expe-
rienced in these channels. Appraisals or automated valuation
models are used to support property values.
In the mortgage industry, it has been common for consumers,
lenders and servicers to purchase mortgage insurance, which
can enhance the credit quality of the loan for investors and
serves generally to expand the market for home ownership.
In our servicing portfolio, certain of the loans we service
carry mortgage insurance, based largely on the requirements
of investors, who bear the ultimate credit risk. Within our
$1.8 trillion owned residential servicing portfolio at December 31,
2008, we service approximately $128 billion of loans that
carry approximately $31 billion of mortgage insurance cover-
age purchased from a group of mortgage insurance compa-
nies that are rated AA or higher by one or more of the major
rating agencies. Should any of these companies experience a
downgrade by one or more of the rating agencies, investors
may be exposed to a higher level of credit risk. In this event,
as servicer, we would work with the investors to determine if
it is necessary to obtain replacement coverage with another
insurer. Our mortgage servicing portfolio consists of over
85% prime loans and we continue to be among the highest
rated loan servicers for residential real estate mortgage loans,
based on various servicing criteria. The foreclosure rate in
our mortgage servicing portfolio was 1.4% at year-end 2008.
Similarly, for certain loans that we held for investment or
for sale at December 31, 2008, we obtained approximately
$3 billion of mortgage insurance coverage. In the event a
mortgage insurer is unable to meet its obligations on defaulted
loans in accordance with the insurance contract, we might be
exposed to higher credit losses if replacement coverage on
those loans cannot be obtained. However, approximately
one-fourth of the coverage related to the debt consolidation
nonprime real estate 1-4 family mortgage loans held by
Wells Fargo Financial, which have had a low level of credit
losses (0.99% loss rate in 2008 for the entire debt consolidation
portfolio). The remaining coverage primarily related to prime
real estate 1-4 family mortgage loans, primarily high quality
ARMs for our retail and wealth management customers,
which also have had low loss rates.
Each business unit regularly completes asset quality fore-
casts to quantify its intermediate-term outlook for loan losses
and recoveries, nonperforming loans and market trends. To
make sure our overall loss estimates and the allowance for
credit losses are adequate, we conduct periodic stress tests.
This includes a portfolio loss simulation model that simulates
a range of possible losses for various sub-portfolios assuming
various trends in loan quality, stemming from economic con-
ditions or borrower performance.
We routinely review and evaluate risks that are not bor-
rower specific but that may influence the behavior of a partic-
ular credit, group of credits or entire sub-portfolios. We also
assess risk for particular industries, geographic locations
such as states or Metropolitan Statistical Areas (MSAs) and
specific macroeconomic trends.
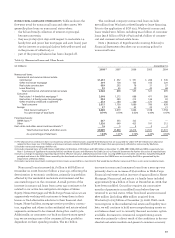
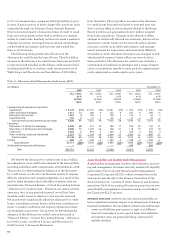
Loan Portfolio Concentrations
Loan concentrations may exist when there are borrowers engaged
in similar activities or types of loans extended to a diverse group
of borrowers that could cause those borrowers or portfolios to be
similarly impacted by economic or other conditions.
Table 14: Real Estate 1-4 Family Mortgage Loans by State
(in millions) December 31, 2008
Real estate Real estate Total real % of
1-4 family 1-4 family estate 1-4 total
first junior lien family loans
mortgage mortgage mortgage
SOP 03-3 loans:
California $ 26,196 $ 300 $ 26,496 3%
Florida 4,012 142 4,154 1
New Jersey 1,175 54 1,229 *
Arizona 971 15 986 *
Other (1) 6,860 217 7,077 *
Total SOP
03-3 loans 39,214 728 39,942 4
All other loans:
California 59,921 32,209 92,130 11
Florida 22,234 9,334 31,568 4
New Jersey 10,470 6,810 17,280 2
Virginia 6,864 5,171 12,035 1
New York 7,607 4,142 11,749 1
Pennsylvania 7,094 4,335 11,429 1
North Carolina 7,365 3,978 11,343 1
Texas 7,688 1,944 9,632 1
Georgia 5,528 3,829 9,357 1
Arizona 5,287 3,582 8,869 1
Other (2) 68,622 34,102 102,724 13
Total all
other loans 208,680 109,436 318,11637
Total $247,894 $110,164 $358,058 41%
* Less than 1%.
(1) Consists of 46 states; no state had loans in excess of $704 million.
(2) Consists of 40 states; no state had loans in excess of $8,127 million. Includes
$7,880 million in GNMA early pool buyouts.
REAL ESTATE 1-4 FAMILY FIRST MORTGAGE LOANS As part of
the Wachovia acquisition, we have acquired residential first
and home equity loans that are very similar to the Wells Fargo
originated portfolio for these loan types. Additionally, we
acquired the Pick-a-Pay option ARM first mortgage portfolio.
The nature of this product creates an potential opportunity
for negative amortization. As part of our purchase accounting
activities, the option ARM loans with the highest probability
of default were marked down to fair value. The concentra-
tions of real estate 1-4 family mortgage loans by state are