Wells Fargo 2008 Annual Report Download - page 62
Download and view the complete annual report
Please find page 62 of the 2008 Wells Fargo annual report below. You can navigate through the pages in the report by either clicking on the pages listed below, or by using the keyword search tool below to find specific information within the annual report.-
 1
1 -
2
-
3
-
4
-
5
-
6
-
7
-
8
-
9
-
10
-
11
-
12
-
13
-
14
-
15
-
16
-
17
-
18
-
19
-
20
-
21
-
22
-
23
-
24
-
25
-
26
-
27
-
28
-
29
-
30
-
31
-
32
-
33
-
34
-
35
-
36
-
37
-
38
-
39
-
40
-
41
-
42
-
43
-
44
-
45
-
46
-
47
-
48
-
49
-
50
-
51
-
 52
52 -
 53
53 -
 54
54 -
 55
55 -
 56
56 -
 57
57 -
 58
58 -
 59
59 -
 60
60 -
 61
61 -
 62
62 -
 63
63 -
 64
64 -
 65
65 -
 66
66 -
 67
67 -
 68
68 -
 69
69 -
 70
70 -
 71
71 -
 72
72 -
73
-
74
-
75
-
76
-
77
-
78
-
79
-
80
-
81
-
82
-
83
-
84
-
85
-
86
-
87
-
88
-
89
-
90
-
91
-
92
-
93
-
94
-
95
-
96
-
97
-
98
-
99
-
100
-
101
-
102
-
103
-
104
-
105
-
106
-
107
-
108
-
109
-
110
-
111
-
112
-
113
-
114
-
115
-
116
-
117
-
118
-
119
-
120
-
121
-
122
-
123
-
124
-
125
-
126
-
127
-
128
-
129
-
130
-
131
-
132
-
133
-
134
-
135
-
136
-
137
-
138
-
139
-
140
-
141
-
142
-
143
-
144
-
145
-
146
-
147
-
148
-
149
-
150
-
151
-
152
-
153
-
154
-
155
-
156
-
157
-
158
-
159
-
160
-
161
-
162
-
163
-
164
-
165
-
166
-
167
-
168
-
169
-
170
-
171
-
172
 |
 |

Some of our real estate 1-4 family mortgage loans, includ-
ing first mortgage and home equity products, include an
interest-only feature as part of the loan terms. At December 31,
2008, these loans were approximately 11% of total loans, com-
pared with 20% at the end of 2007. Most of these loans are
considered to be prime or near prime. We have manageable
ARM reset risk across our Wells Fargo originated and owned
mortgage loan portfolios.
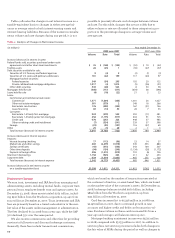
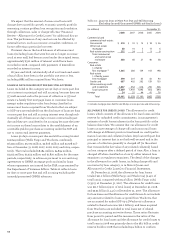
Table 15: Home Equity Portfolios (1)
(in millions) Outstanding % of loans Loss rate (2)
balances two payments
or more past due
December 31, December 31, December 31,
2008 2007 2008 2007 2008 2007
Liquidating portfolio
California $ 4,008 $ 4,387 6.69% 2.94% 9.26% 7.34%
Florida 513 582 8.41 4.98 11.24 7.08
Arizona 244 274 7.40 2.67 8.58 5.84
Texas 191 221 1.27 0.83 1.56 0.78
Minnesota 127 141 3.79 3.18 5.74 4.09
Other 5,226 6,296 3.28 2.00 3.40 2.94
Total 10,309 11,901 4.93 2.50 6.18 4.80
Core portfolio (3)
California 31,544 25,991 2.95 1.63 2.93 1.27
Florida 11,781 2,614 3.36 2.92 2.79 2.57
New Jersey 7,888 1,795 1.41 1.63 0.66 0.42
Virginia 5,688 1,780 1.50 1.14 1.08 0.66
Pennsylvania 5,043 1,002 1.10 1.17 0.38 0.32
Other 56,415 39,147 1.97 1.38 1.14 0.52
Total 118,359 72,329 2.27 1.52 1.70 0.86
Total liquidating and core portfolios 128,668 84,230 2.48 1.66 2.10 1.42
SOP 03-3 portfolio (4) 821 —
Total home equity portfolios $129,489 $84,230
(1) Consists of real estate 1-4 family junior lien mortgages and lines of credit secured by real estate from all groups, including the National Home Equity Group, Wachovia,
Wells Fargo Financial and Wealth Management.
(2) Loss rate for 2007 data is based on the annualized loss rate for month of December 2007.
(3) Loss rates for the core portfolio in the table above reflect 2008 results for Wachovia (not included in the Wells Fargo reported results) and Wells Fargo. For the Wells Fargo
core portfolio on a stand-alone basis, outstanding balances and related loss rates were $29,399 million (2.90%) for California, $2,677 million (5.04%) for Florida, $1,925 million
(1.33%) for New Jersey, $1,827 million (1.14%) for Virginia, $1,073 million (0.92%) for Pennsylvania, $38,934 million (1.34%) for all other states, and $75,835 million (2.05%)
in total, at December 31, 2008.
(4) Consists of $728 million real estate 1-4 family junior lien mortgages and $93 million of real estate 1-4 family first mortgages.
presented in the following table. Our real estate 1-4 family
mortgage loans to borrowers in the state of California repre-
sented approximately 14% of total loans at December 31, 2008,
compared with 13% at the end of 2007. Of this amount, 3% of
total loans were credit-impaired loans acquired from Wachovia.
These loans are mostly within the larger metropolitan areas
in California, with no single area consisting of more than 2%
of total loans. Changes in real estate values and underlying
economic or market conditions for these areas are monitored
continuously within the credit risk management process.
Beginning in 2007, the residential real estate markets experi-
enced significant declines in property values, and several mar-
kets in California, specifically the Central Valley and several
Southern California MSAs, experienced more severe declines.