Wells Fargo 2008 Annual Report Download - page 56
Download and view the complete annual report
Please find page 56 of the 2008 Wells Fargo annual report below. You can navigate through the pages in the report by either clicking on the pages listed below, or by using the keyword search tool below to find specific information within the annual report.-
 1
1 -
2
-
3
-
4
-
5
-
6
-
7
-
8
-
9
-
10
-
11
-
12
-
13
-
14
-
15
-
16
-
17
-
18
-
19
-
20
-
21
-
22
-
23
-
24
-
25
-
26
-
27
-
28
-
29
-
30
-
31
-
32
-
33
-
34
-
35
-
36
-
37
-
38
-
39
-
40
-
41
-
42
-
43
-
44
-
45
-
 46
46 -
 47
47 -
 48
48 -
 49
49 -
 50
50 -
 51
51 -
 52
52 -
 53
53 -
 54
54 -
 55
55 -
 56
56 -
 57
57 -
 58
58 -
 59
59 -
 60
60 -
 61
61 -
 62
62 -
 63
63 -
 64
64 -
 65
65 -
 66
66 -
67
-
68
-
69
-
70
-
71
-
72
-
73
-
74
-
75
-
76
-
77
-
78
-
79
-
80
-
81
-
82
-
83
-
84
-
85
-
86
-
87
-
88
-
89
-
90
-
91
-
92
-
93
-
94
-
95
-
96
-
97
-
98
-
99
-
100
-
101
-
102
-
103
-
104
-
105
-
106
-
107
-
108
-
109
-
110
-
111
-
112
-
113
-
114
-
115
-
116
-
117
-
118
-
119
-
120
-
121
-
122
-
123
-
124
-
125
-
126
-
127
-
128
-
129
-
130
-
131
-
132
-
133
-
134
-
135
-
136
-
137
-
138
-
139
-
140
-
141
-
142
-
143
-
144
-
145
-
146
-
147
-
148
-
149
-
150
-
151
-
152
-
153
-
154
-
155
-
156
-
157
-
158
-
159
-
160
-
161
-
162
-
163
-
164
-
165
-
166
-
167
-
168
-
169
-
170
-
171
-
172
 |
 |

Loan Portfolio
A discussion of average loan balances is included in
“Earnings Performance – Net Interest Income” on page 47
and a comparative schedule of average loan balances is
included in Table 3; year-end balances are in Note 6 (Loans
and Allowance for Credit Losses) to Financial Statements.
Total loans at December 31, 2008, were $864.8 billion,
up $482.6 billion from $382.2 billion at December 31, 2007,
including $446.1 billion (net of $30.5 billion of purchase
accounting net write-downs) acquired from Wachovia.
Consumer loans were $474.9 billion at December 31, 2008,
up $253.0 billion from $221.9 billion a year ago, including
$246.8 billion (net of $21.0 billion of purchase accounting net
write-downs) acquired from Wachovia. Commercial and com-
mercial real estate loans of $356.1 billion at December 31,
2008, increased $203.3 billion from a year ago, including
$171.4 billion (net of $7.9 billion of purchase accounting net
write-downs) acquired from Wachovia. Mortgages held for
sale decreased to $20.1 billion at December 31, 2008, from
$26.8 billion a year ago, including $1.4 billion acquired from
Wachovia.
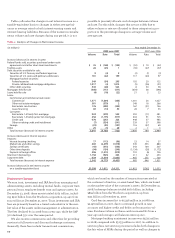
A summary of the major categories of loans outstanding
showing those subject to SOP 03-3 is presented in the follow-
ing table. For further detail on SOP 03-3 loans see Note 1
(Summary of Significant Accounting Policies – Loans) and
Note 6 (Loans and Allowance for Credit Losses).
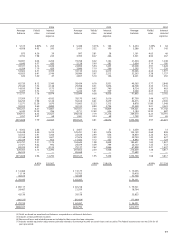
Table 9: Maturities for Selected Loan Categories
(in millions) December 31, 2008
Within After After Total
one one year five
year through years
five years
Selected loan maturities:
Commercial $ 59,246 $109,764 $33,459 $202,469
Other real estate
mortgage 23,880 45,565 33,663 103,108
Real estate construction 19,270 13,942 1,464 34,676
Foreign 23,605 7,288 2,989 33,882
Total selected loans $126,001 $176,559 $71,575 $374,135
Sensitivity of loans due after
one year to changes in
interest rates:
Loans at fixed interest rates $ 24,766 $23,628
Loans at floating/variable
interest rates 151,793 47,947
Total selected loans $176,559 $71,575
Table 8: Loan Portfolios
(in millions) December 31,
2008 2007
SOP 03-3 All Total
loans other
loans
Commercial and commercial real estate:
Commercial $ 4,580 $197,889 $202,469 $ 90,468
Other real estate mortgage 7,762 95,346 103,108 36,747
Real estate construction 4,503 30,173 34,676 18,854
Lease financing — 15,829 15,829 6,772
Total commercial and commercial real estate 16,845 339,237 356,082 152,841
Consumer:
Real estate 1-4 family first mortgage 39,214 208,680 247,894 71,415
Real estate 1-4 family junior lien mortgage 728 109,436 110,164 75,565
Credit card — 23,555 23,555 18,762
Other revolving credit and installment 151 93,102 93,253 56,171
Total consumer 40,093 434,773 474,866 221,913
Foreign 1,859 32,023 33,882 7,441
Total loans $58,797 $806,033 $864,830 $382,195
Table 9 shows contractual loan maturities and interest
rate sensitivities for selected loan categories.